Graph
The graph widget allows you to display a set of time dependant metrics on a graph. After choosing an instrument, you can decide to add multiple graphs above each other in order to view the evolution of different metrics, or add multiple metrics to the same graph.

Usage
Instrument
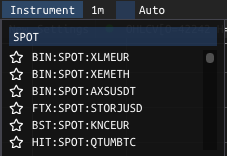 Use the Instrument button in order to select the targeted asset you wish to retrieve metrics for. Decide which pair you want to study and from which exchange you want to query the data.
 New
Use the New button in order to add a metric to the selected graph. All the metrics displayed below can be added to your graphs. 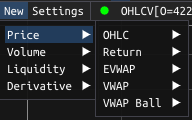
Available metrics
In the following sections, all the available metrics are presented for each of the four main tabs: Price, Volume, Liquidity and Derivative.
Price
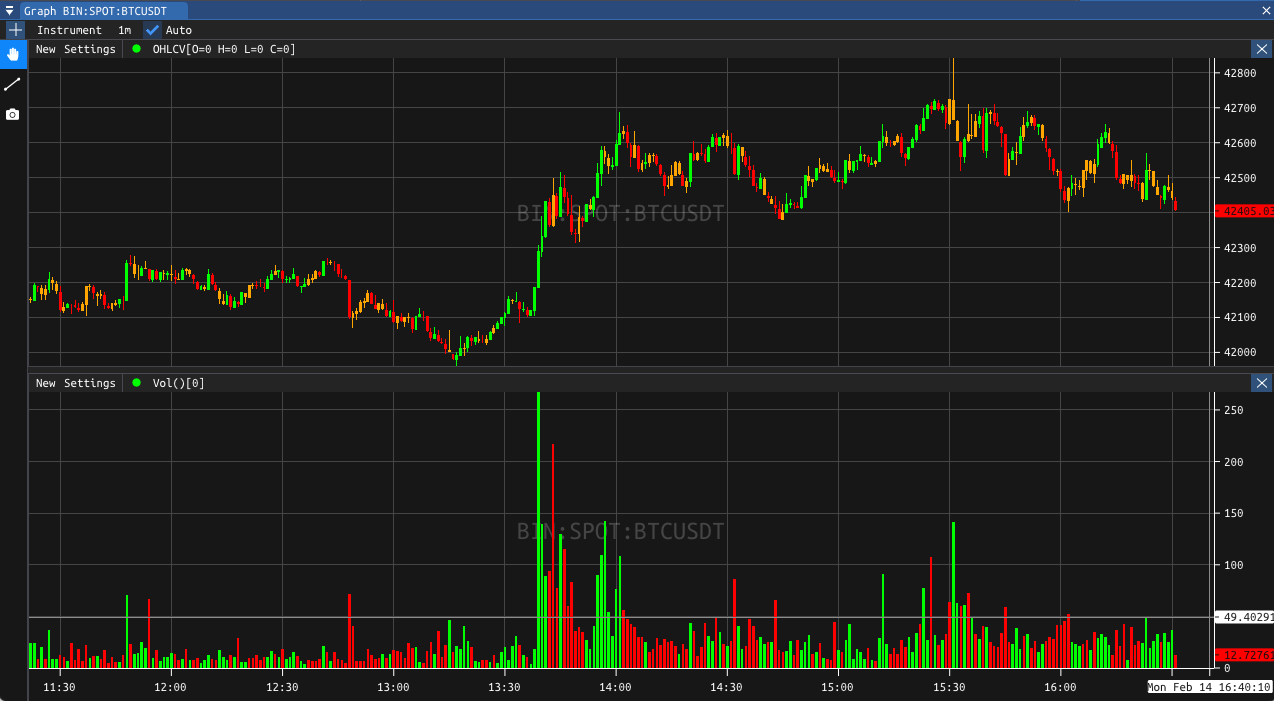
Open-High-Low-Close
The Open-High-Low-Close (OHLC) chart allows you to display the movement in price of an asset. Each candlestick in the graph will display the opening and close price as well as the highest and lowest price level for the selected time step. Up to four colors can be selected in order to differentiate the Buy and Sell as well as the Contrarian Buy and Contrarian Sell. 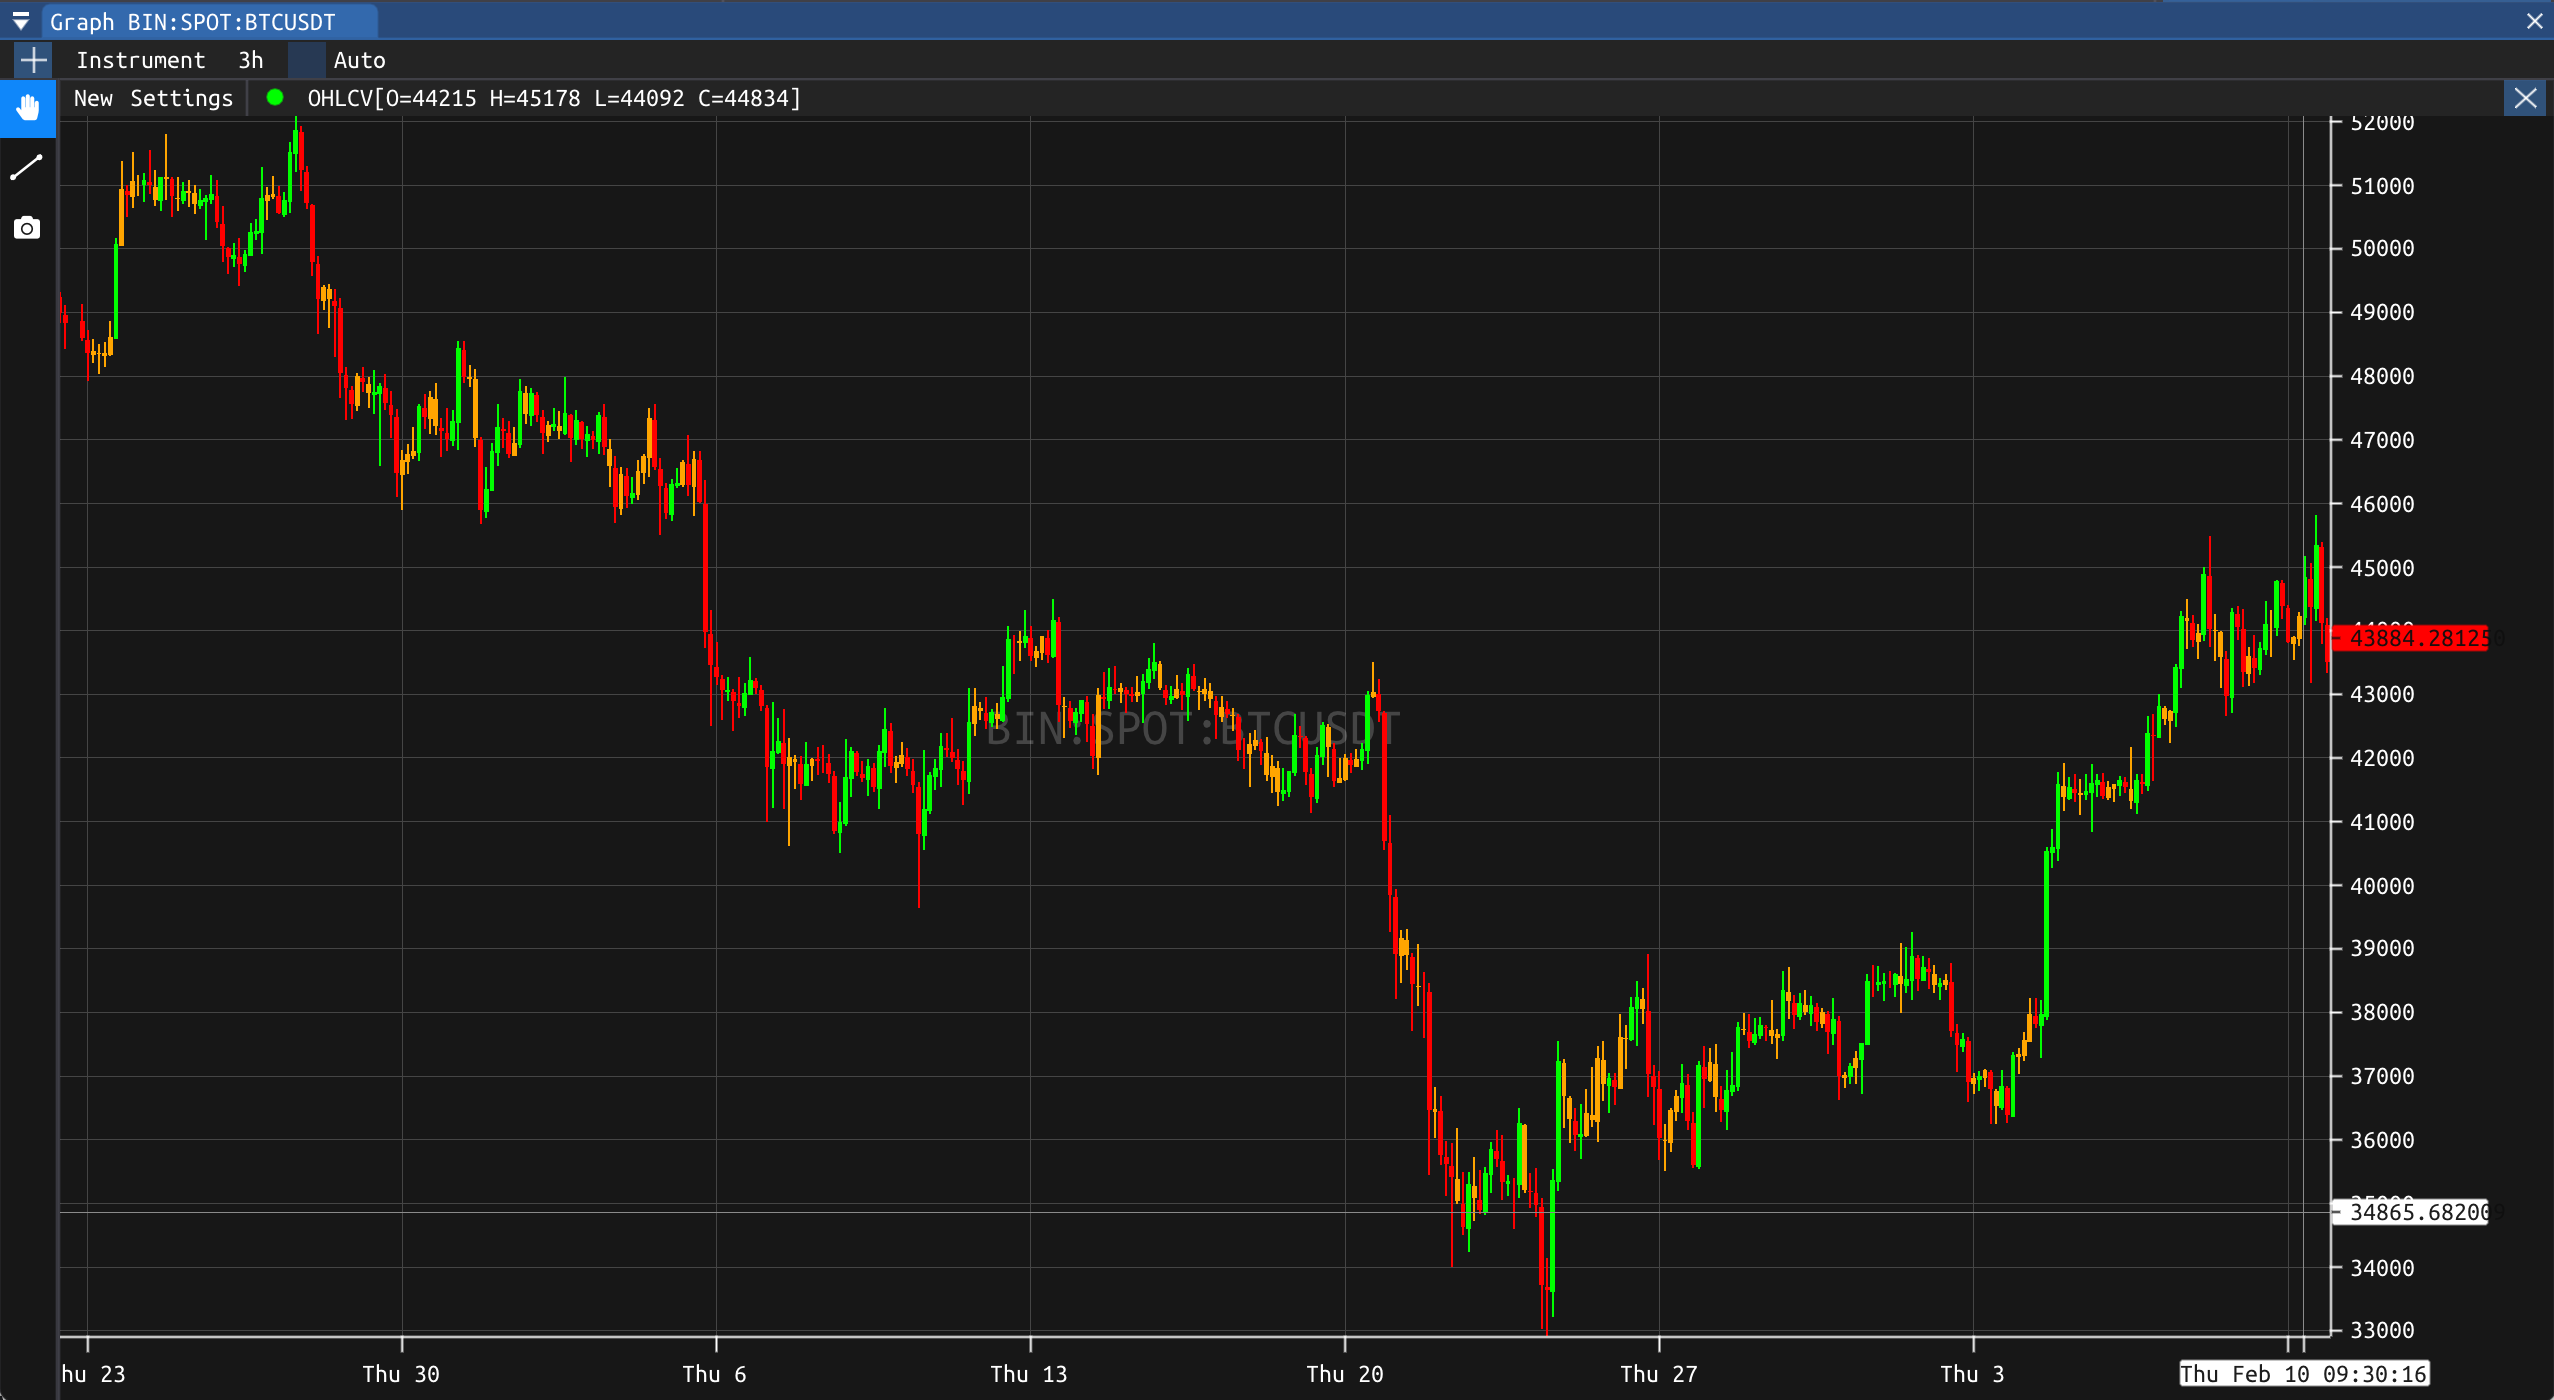
Return
The Return will display the scaled price for an asset. The price is scaled by the starting price for the asset at the start of the selected period. The Return metric can be used in order to compare the performance of different assets. 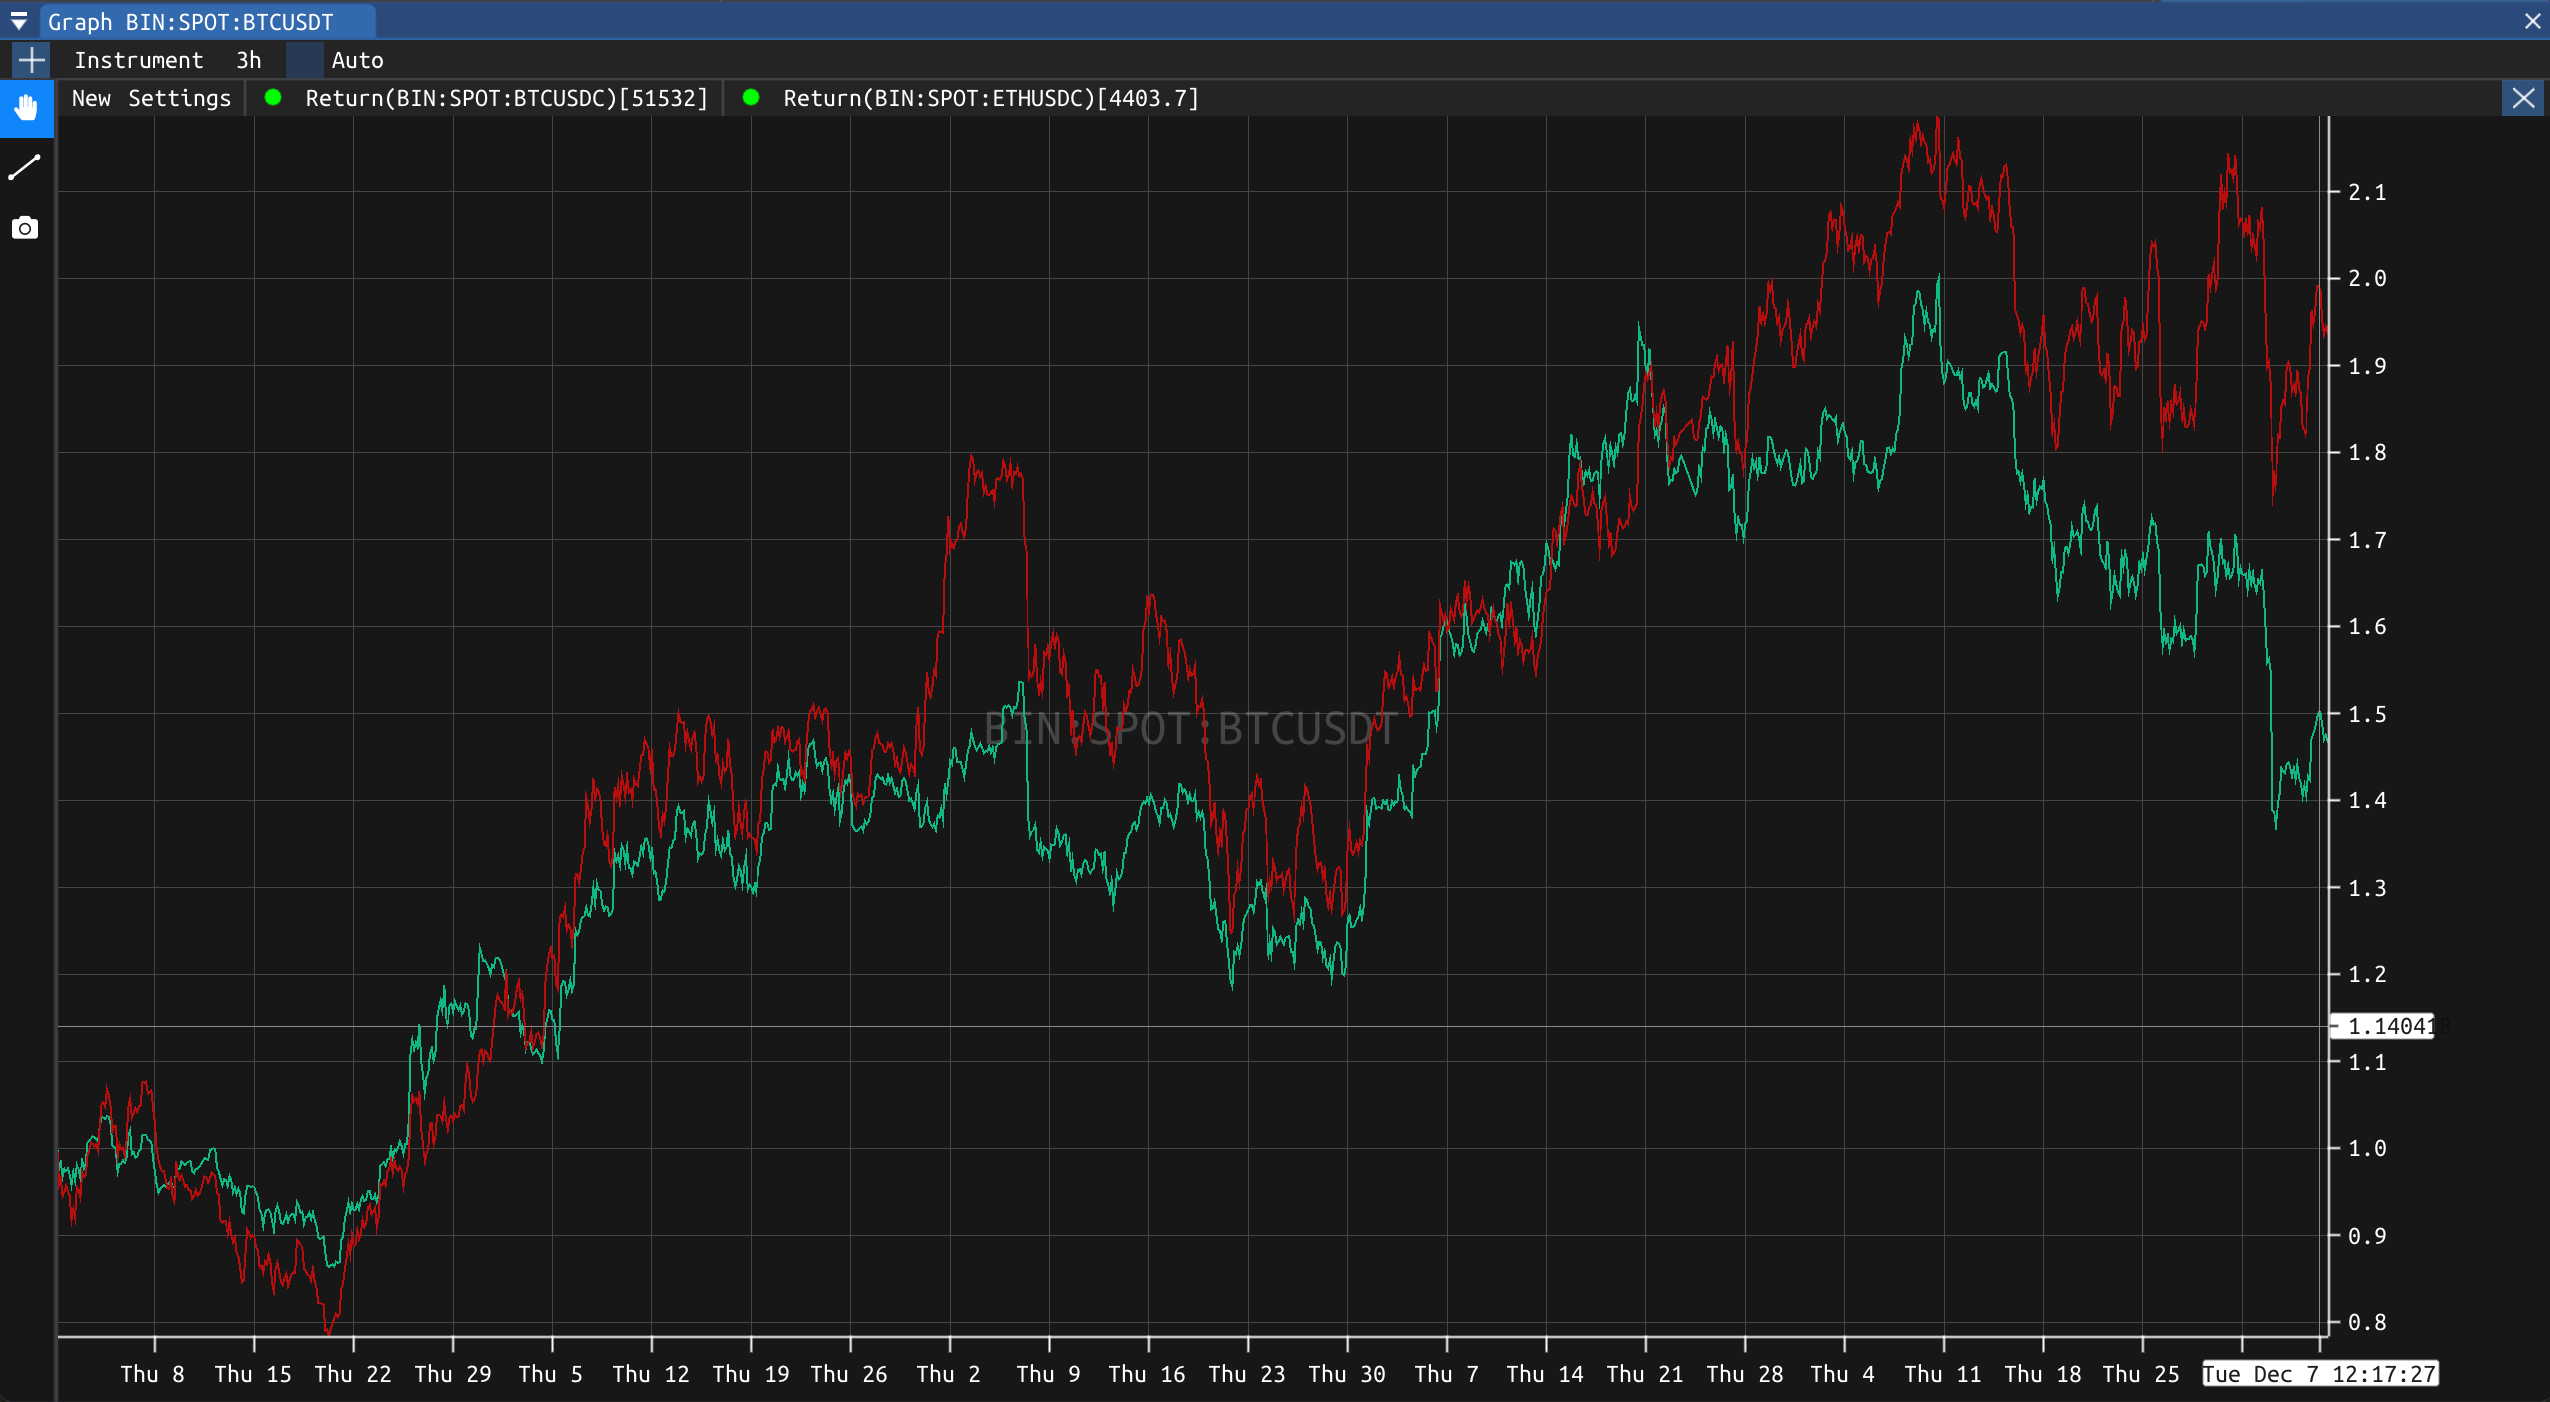
Exponential Volume Weighted Average Price
The Exponential Volume Weighted Average Price (EVWAP) is an exponential moving average of the price weighted by the volume traded at each price. The EVWAP is used to compute a smoothed out price of the asset, the smoothing factor being controlled through the half-life parameter. 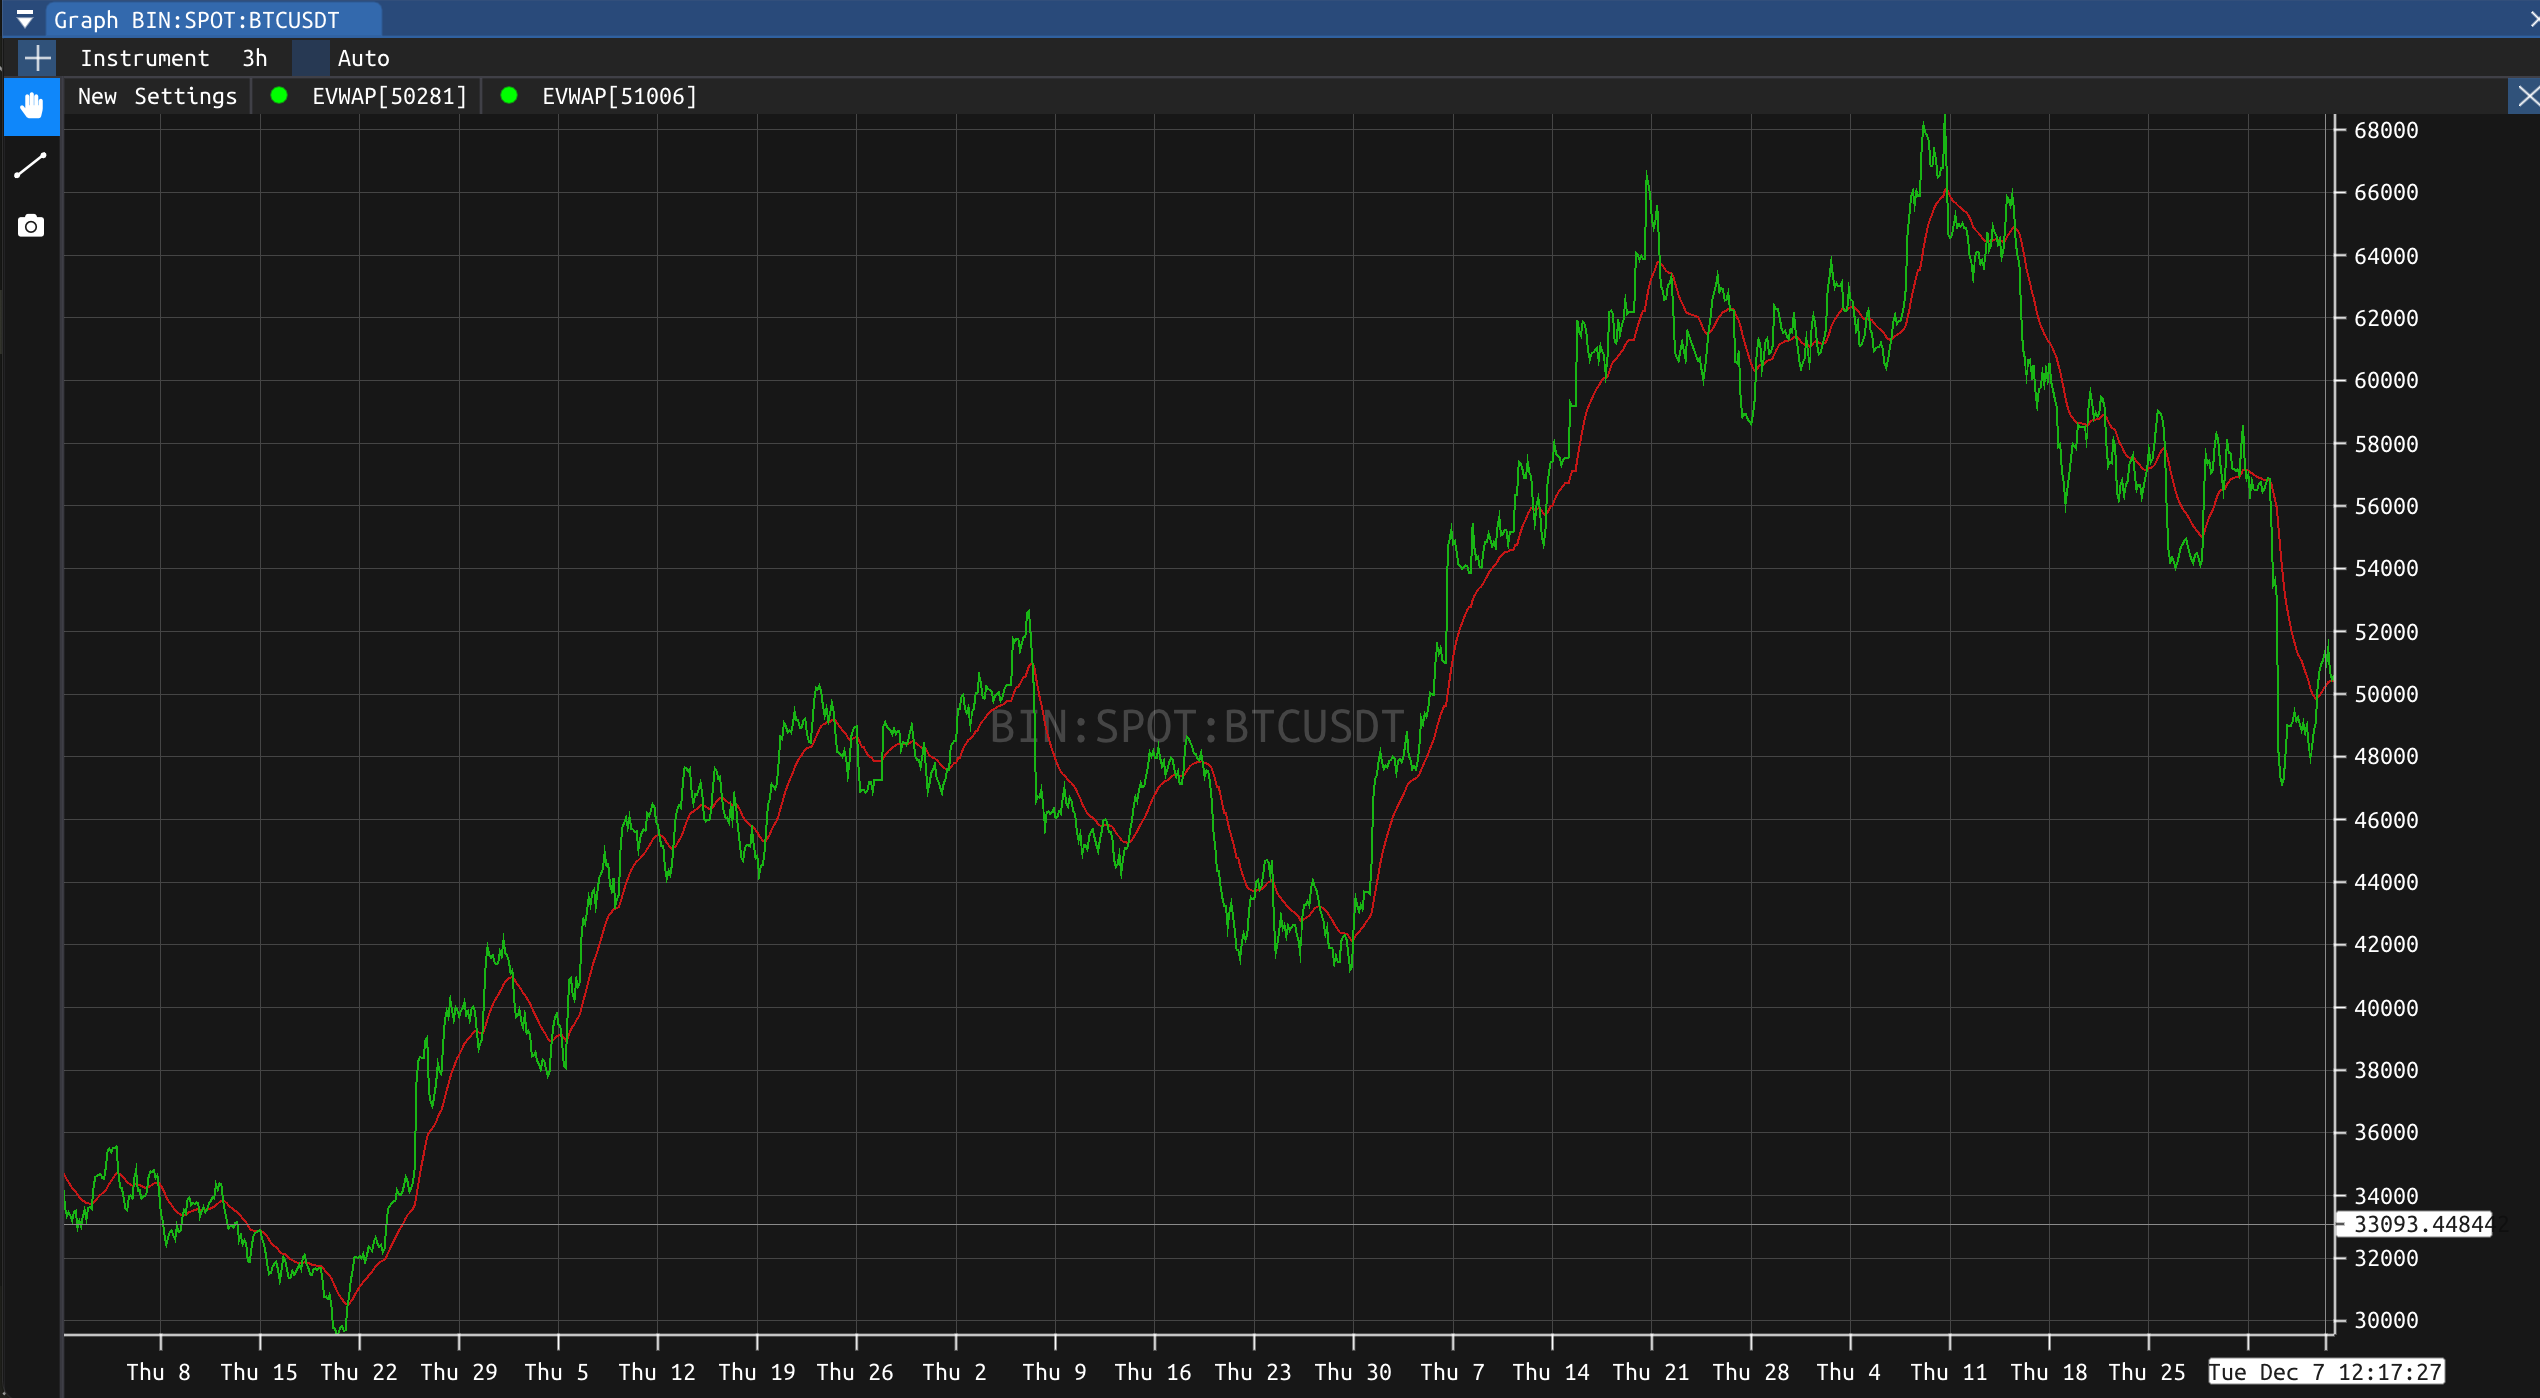
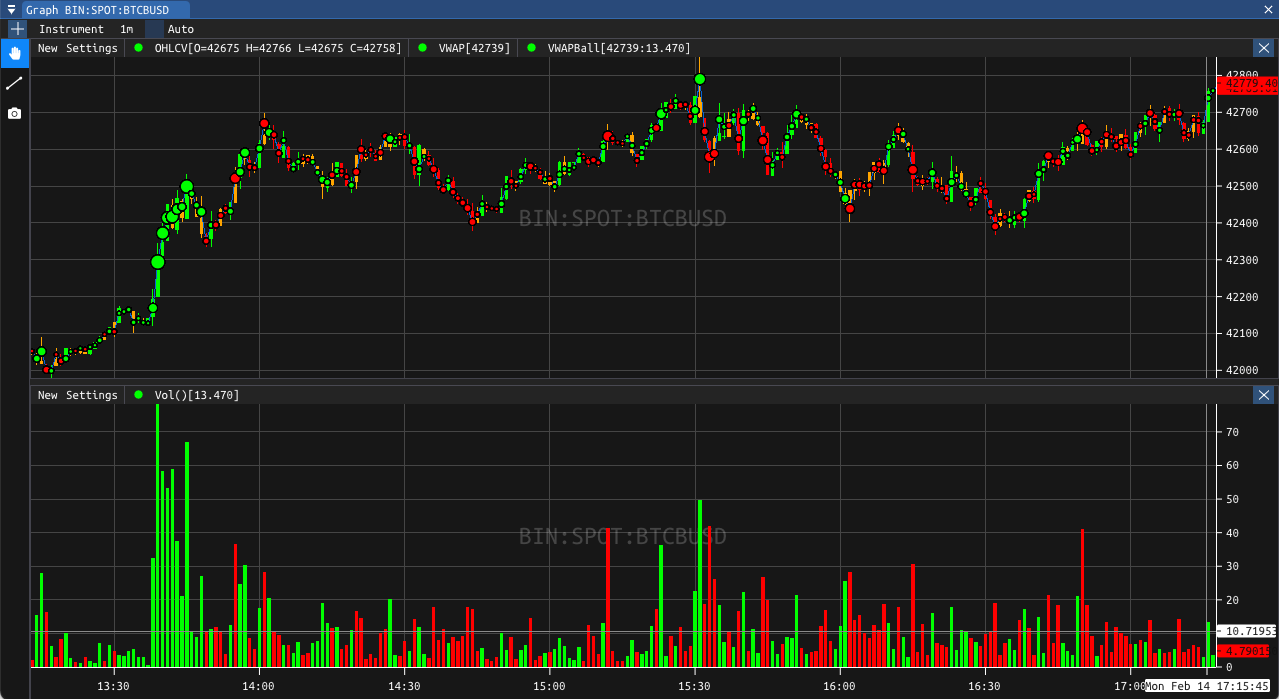
Volume Weighted Average Price
The Volume Weighted Average Price (VWAP) allows you to display the average price of an asset weighted by the volume traded for that asset over a period of time. As previously with the EVWAP, the longer the period of time selected for the computation of the VWAP, the higher the smoothing obtained on the final price curve.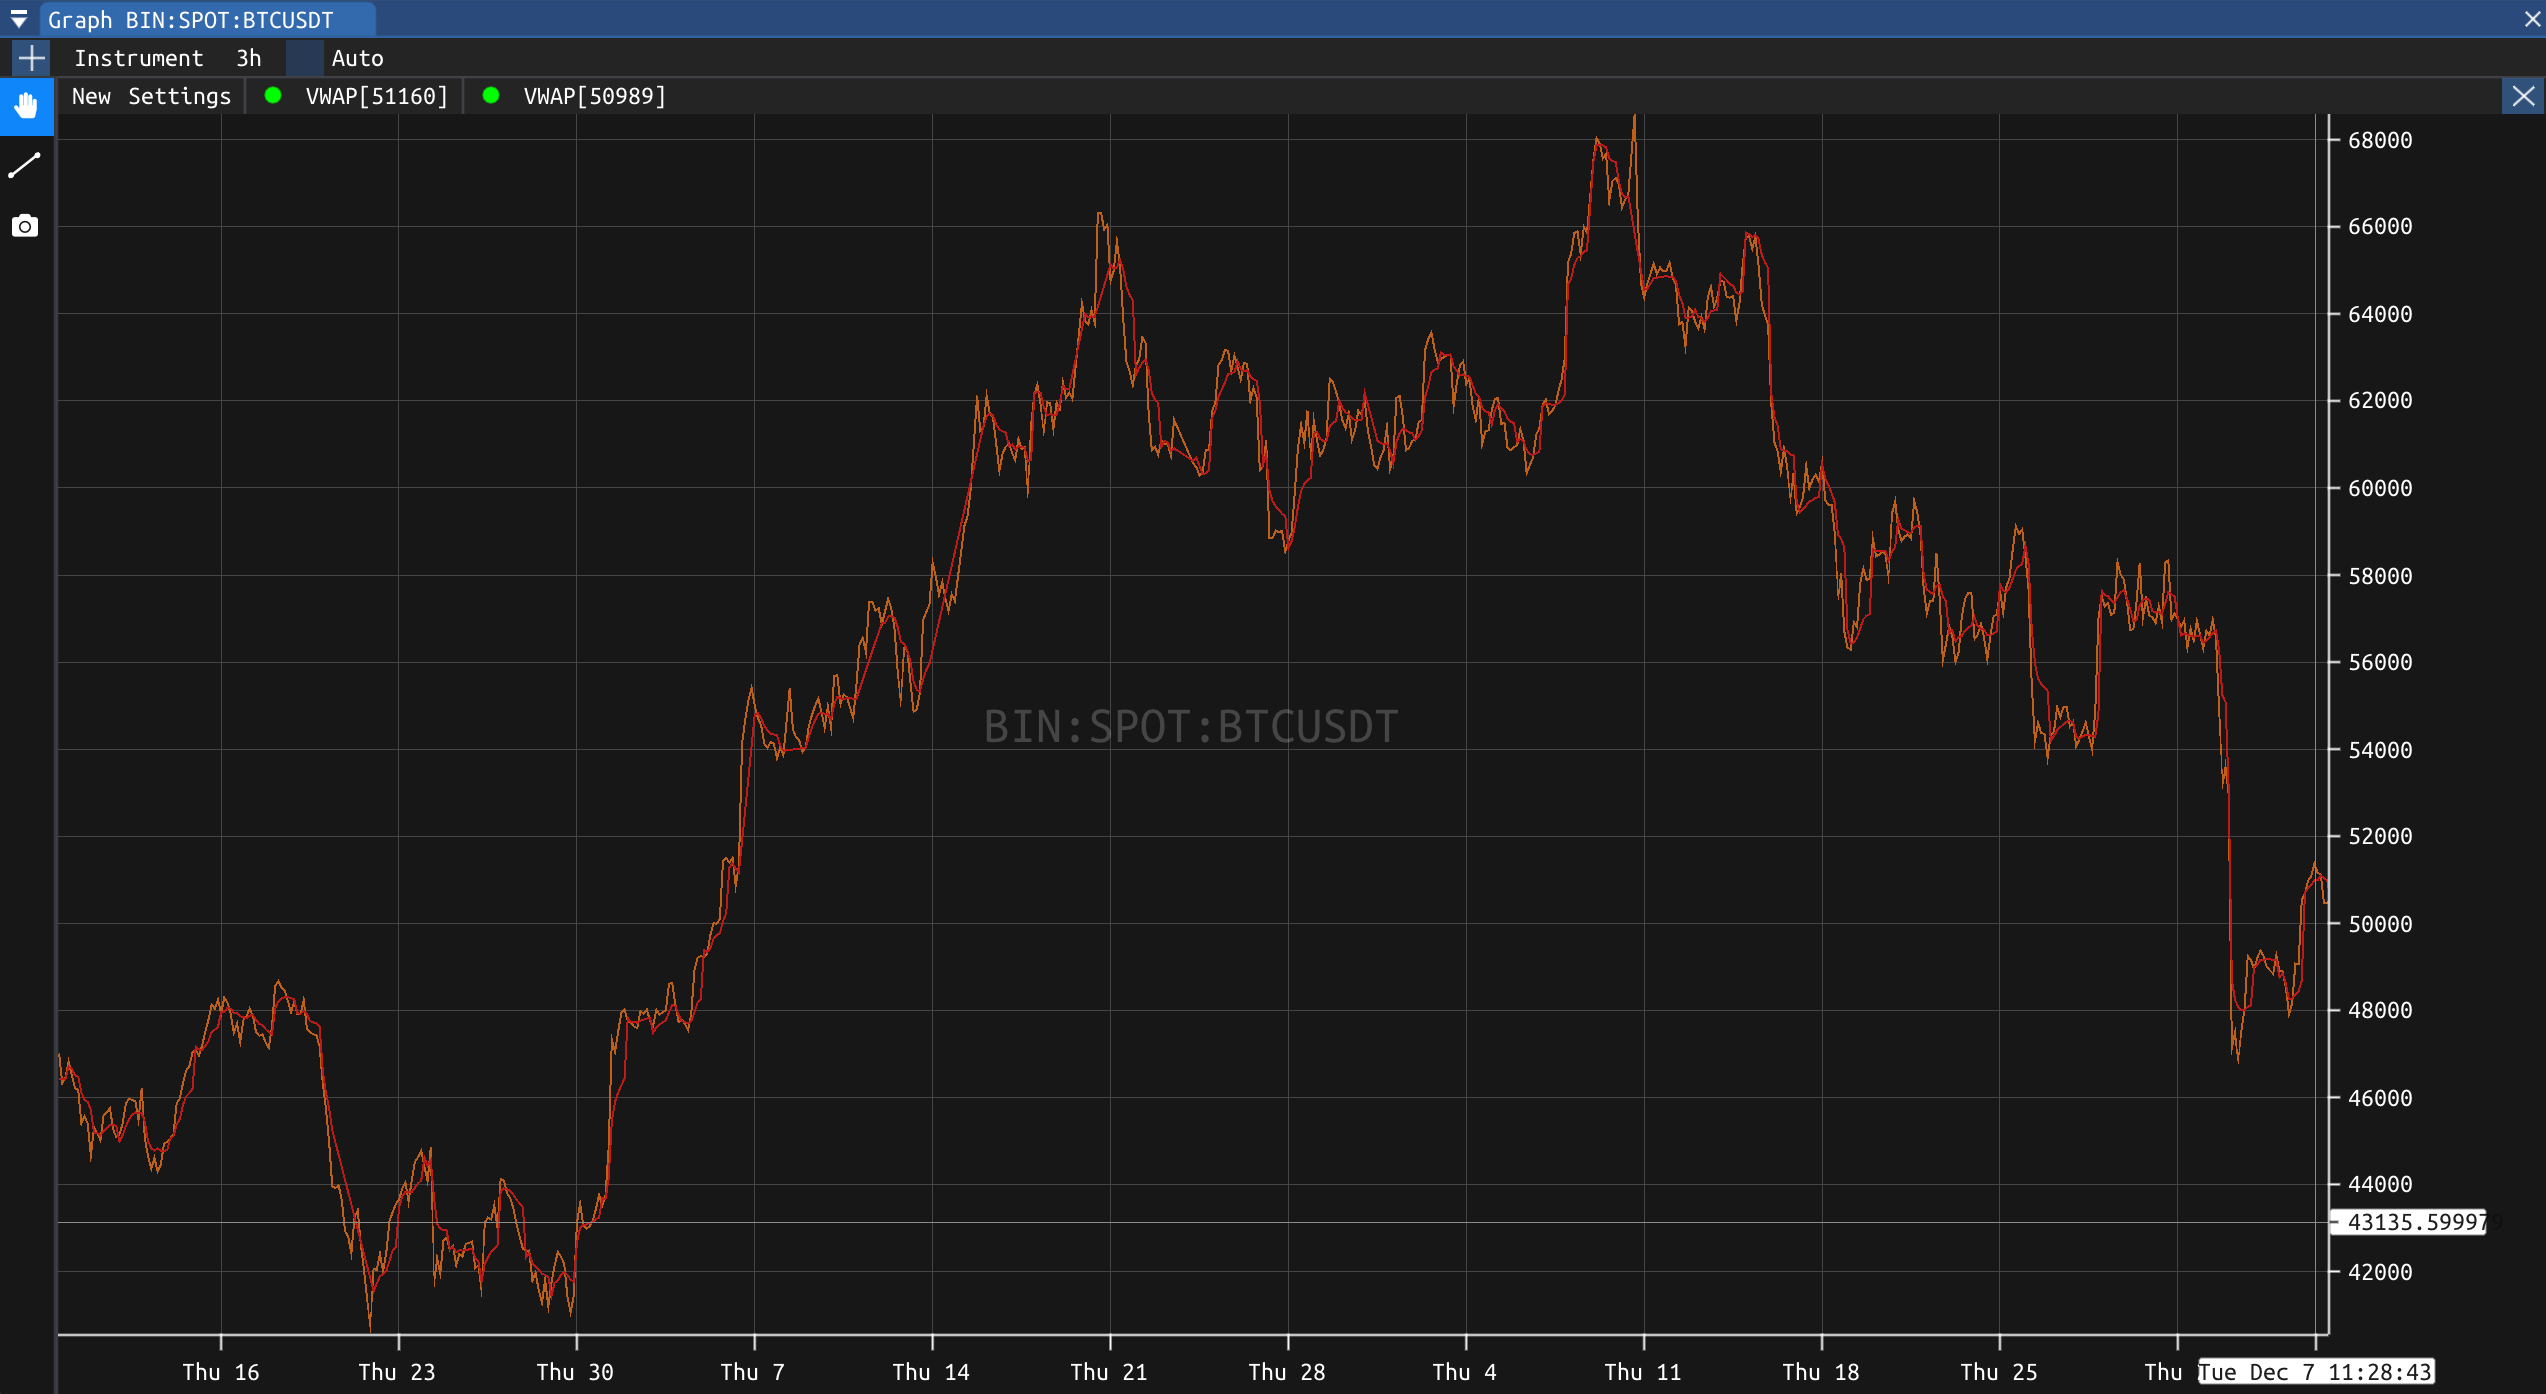
Volume Weighted Average Price Ball
The VWAP Ball is the same metric as described in the previous section with the buy and sell events being depected as balls. 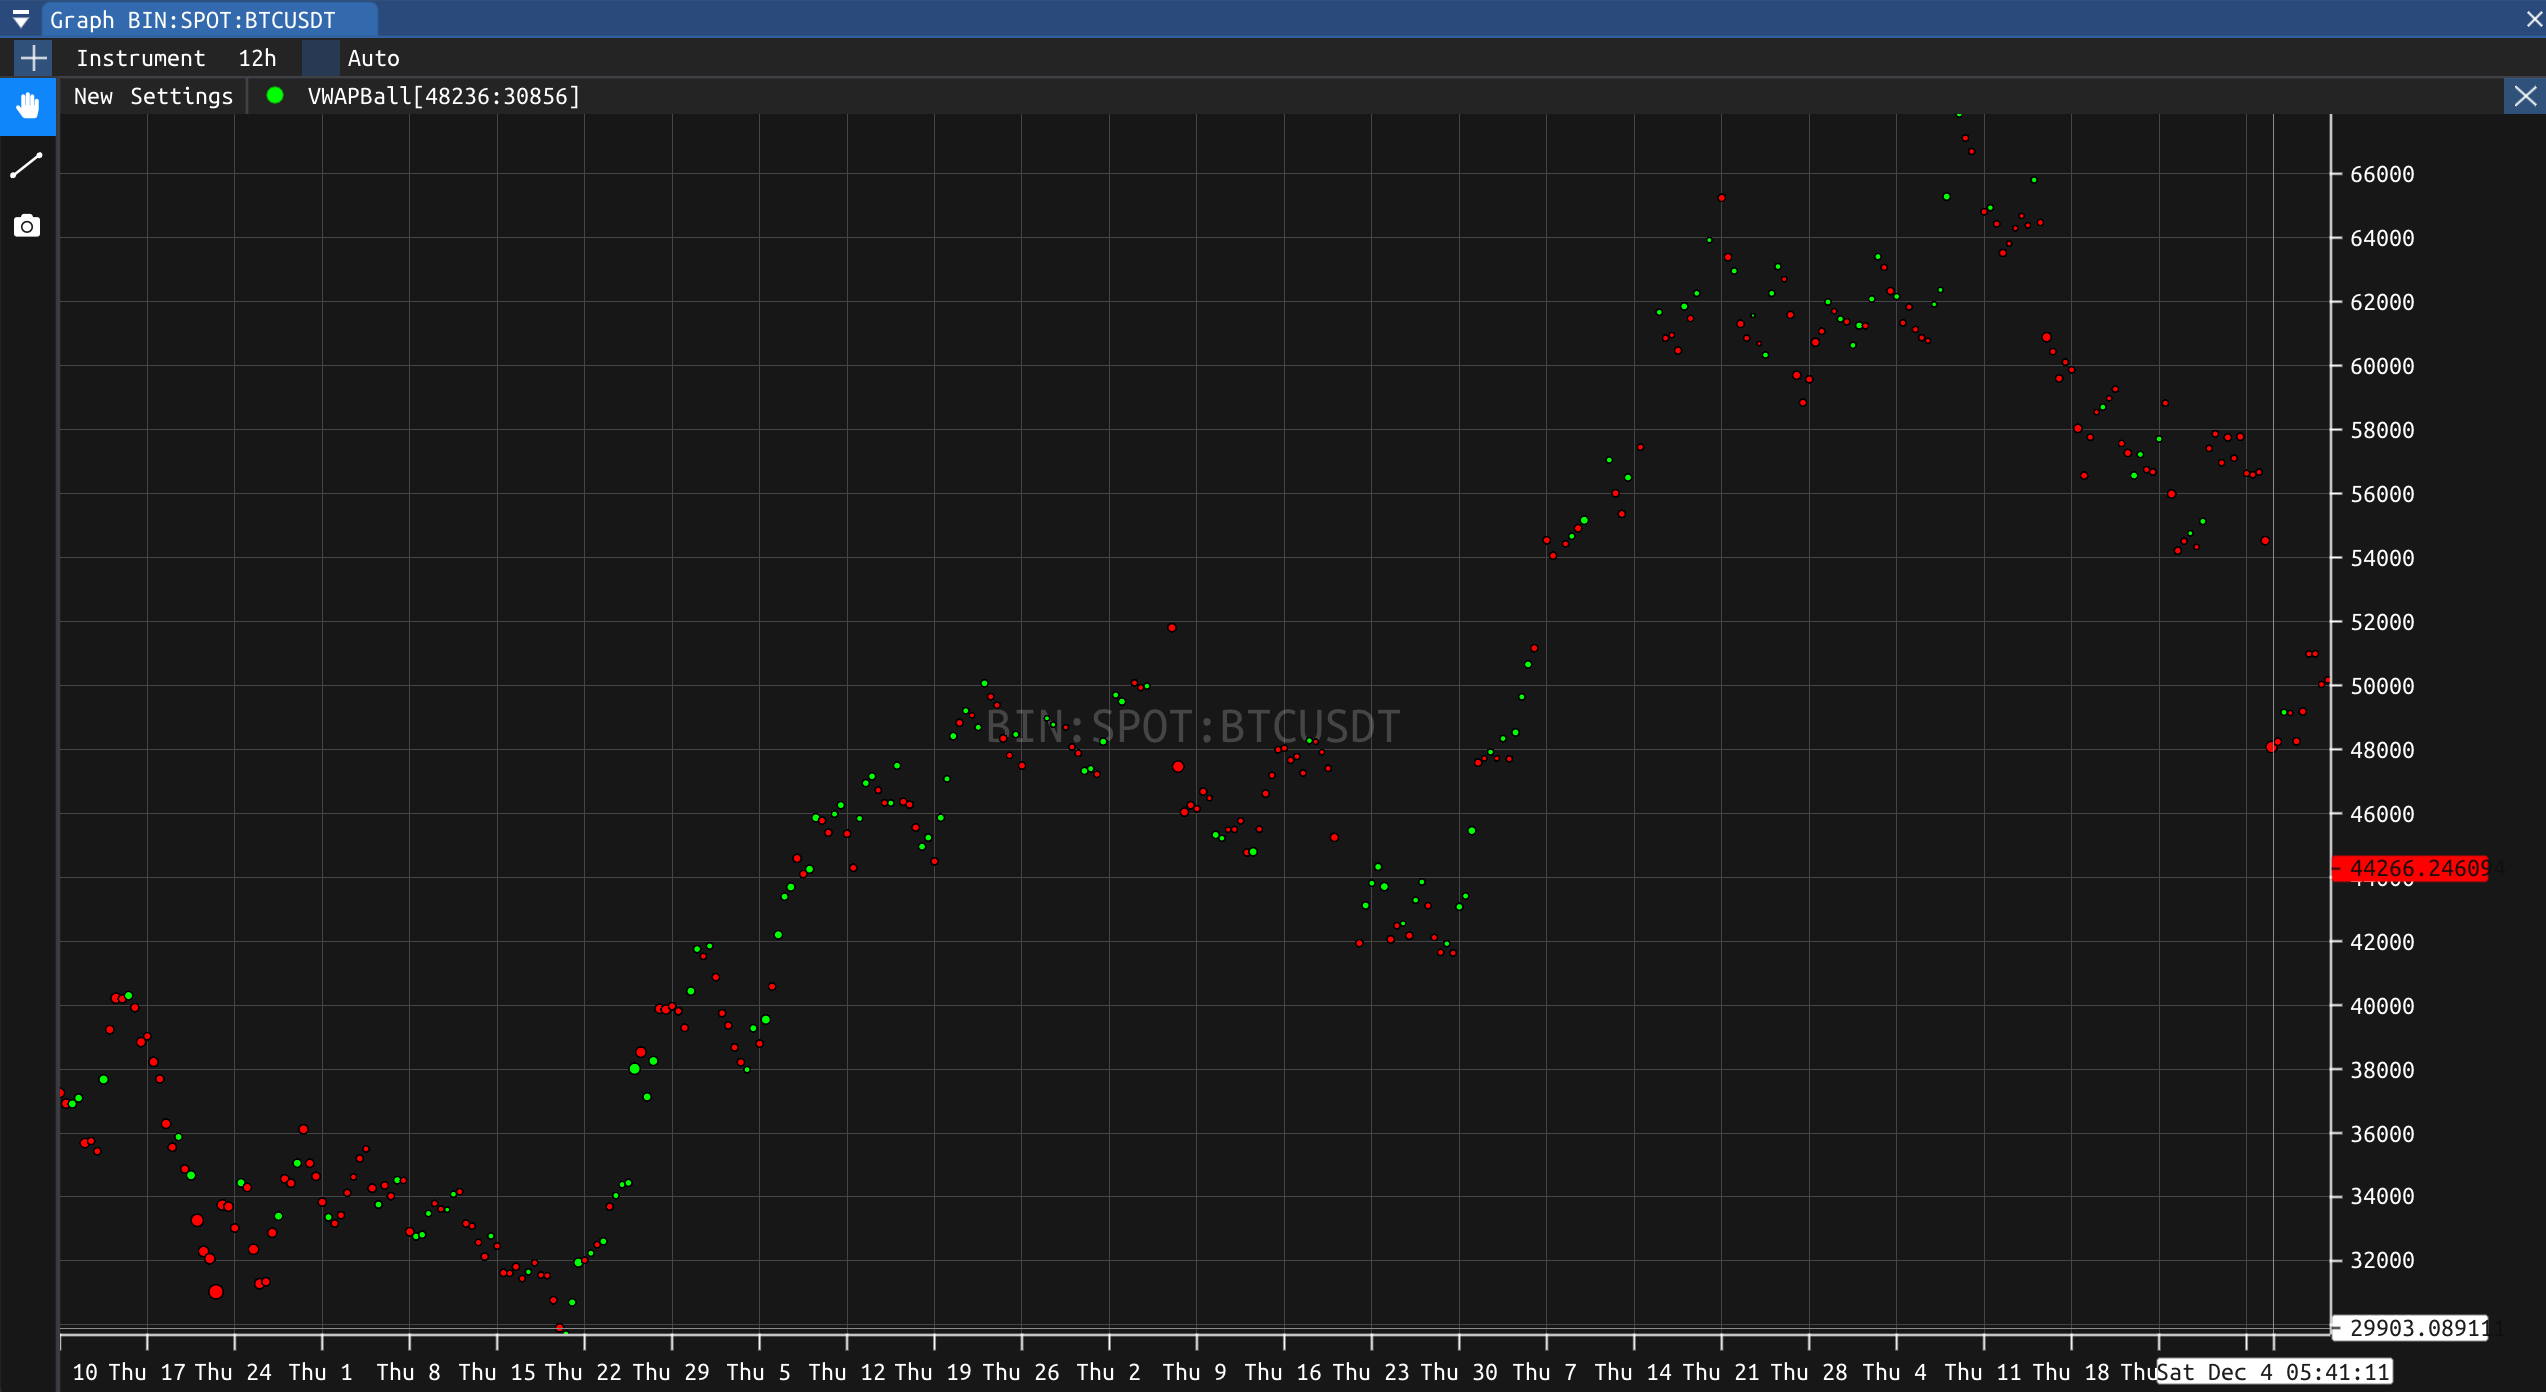
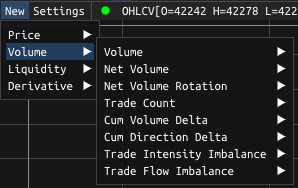
Volume
Volume
The first available metric for the Volume tab is the volume itself. The y scale for the volume will indicate the quantity traded for the first asset of the selected pair (e.g. the volume of BTC traded can be viewed by displaying the volume for the pair BTC/USD) 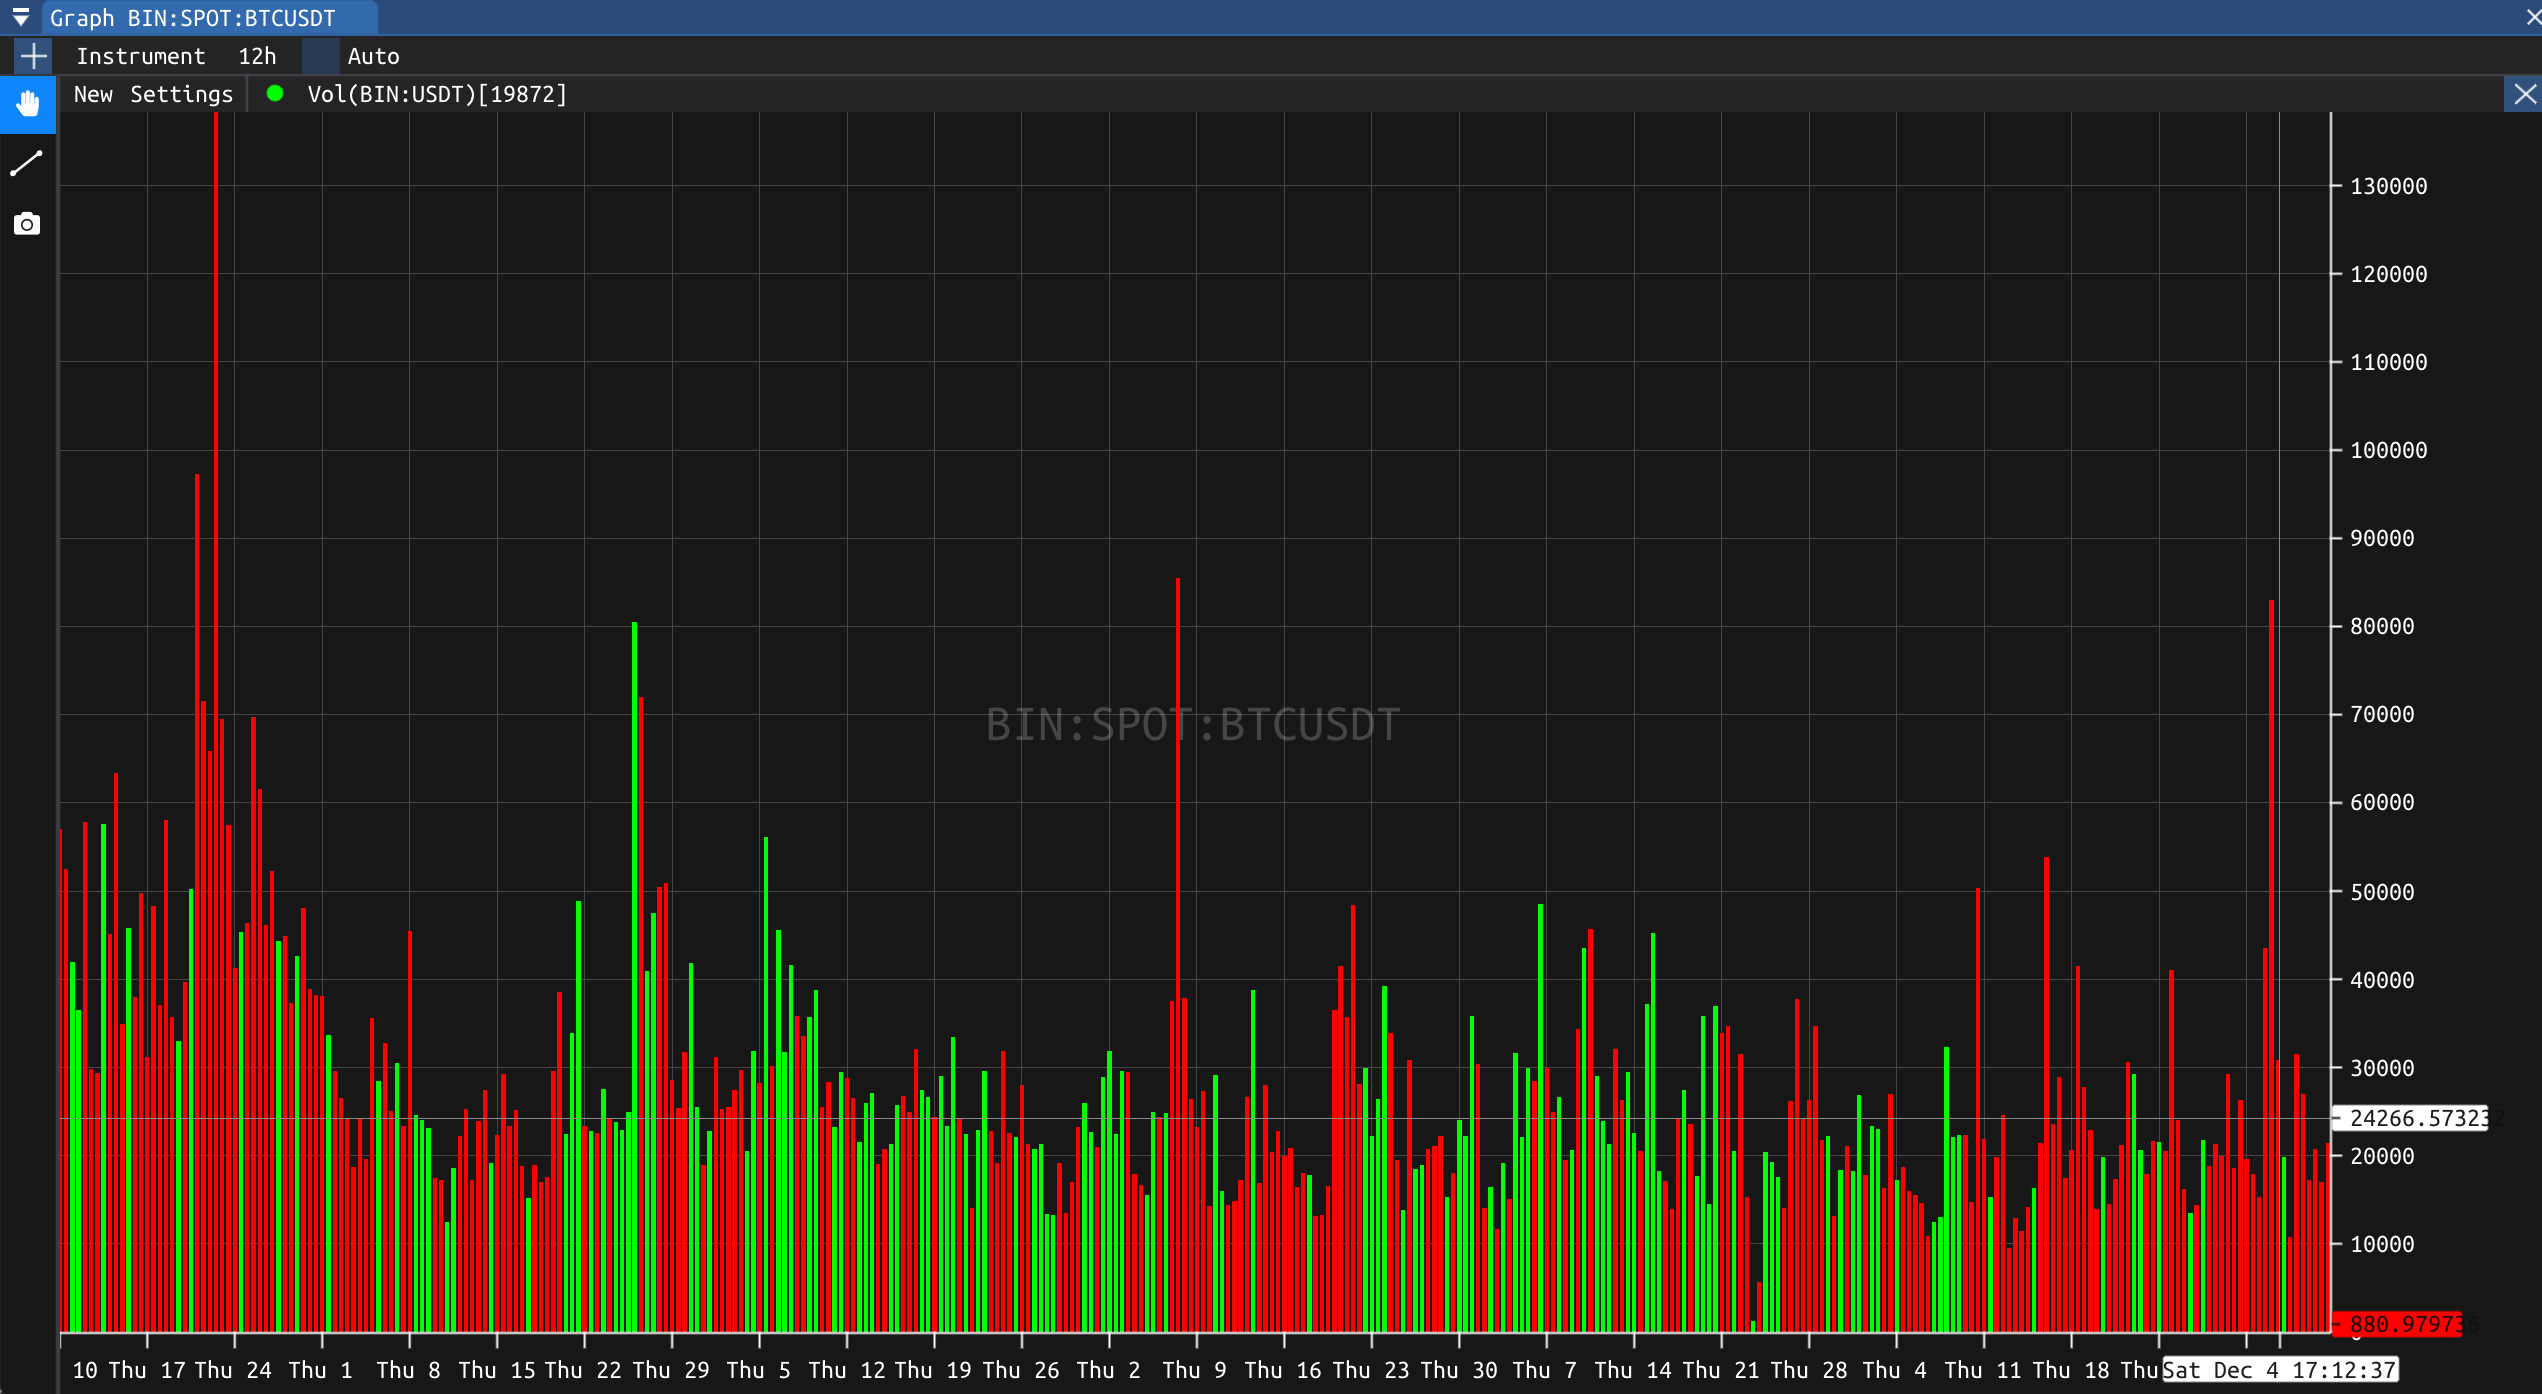
Net Volume
As opposed to the volume which will indicate the trade volume be it buy or sell, the net volume will be the result of the uptick volume minus the downtick volume, giving a better indication of the market's current direction. 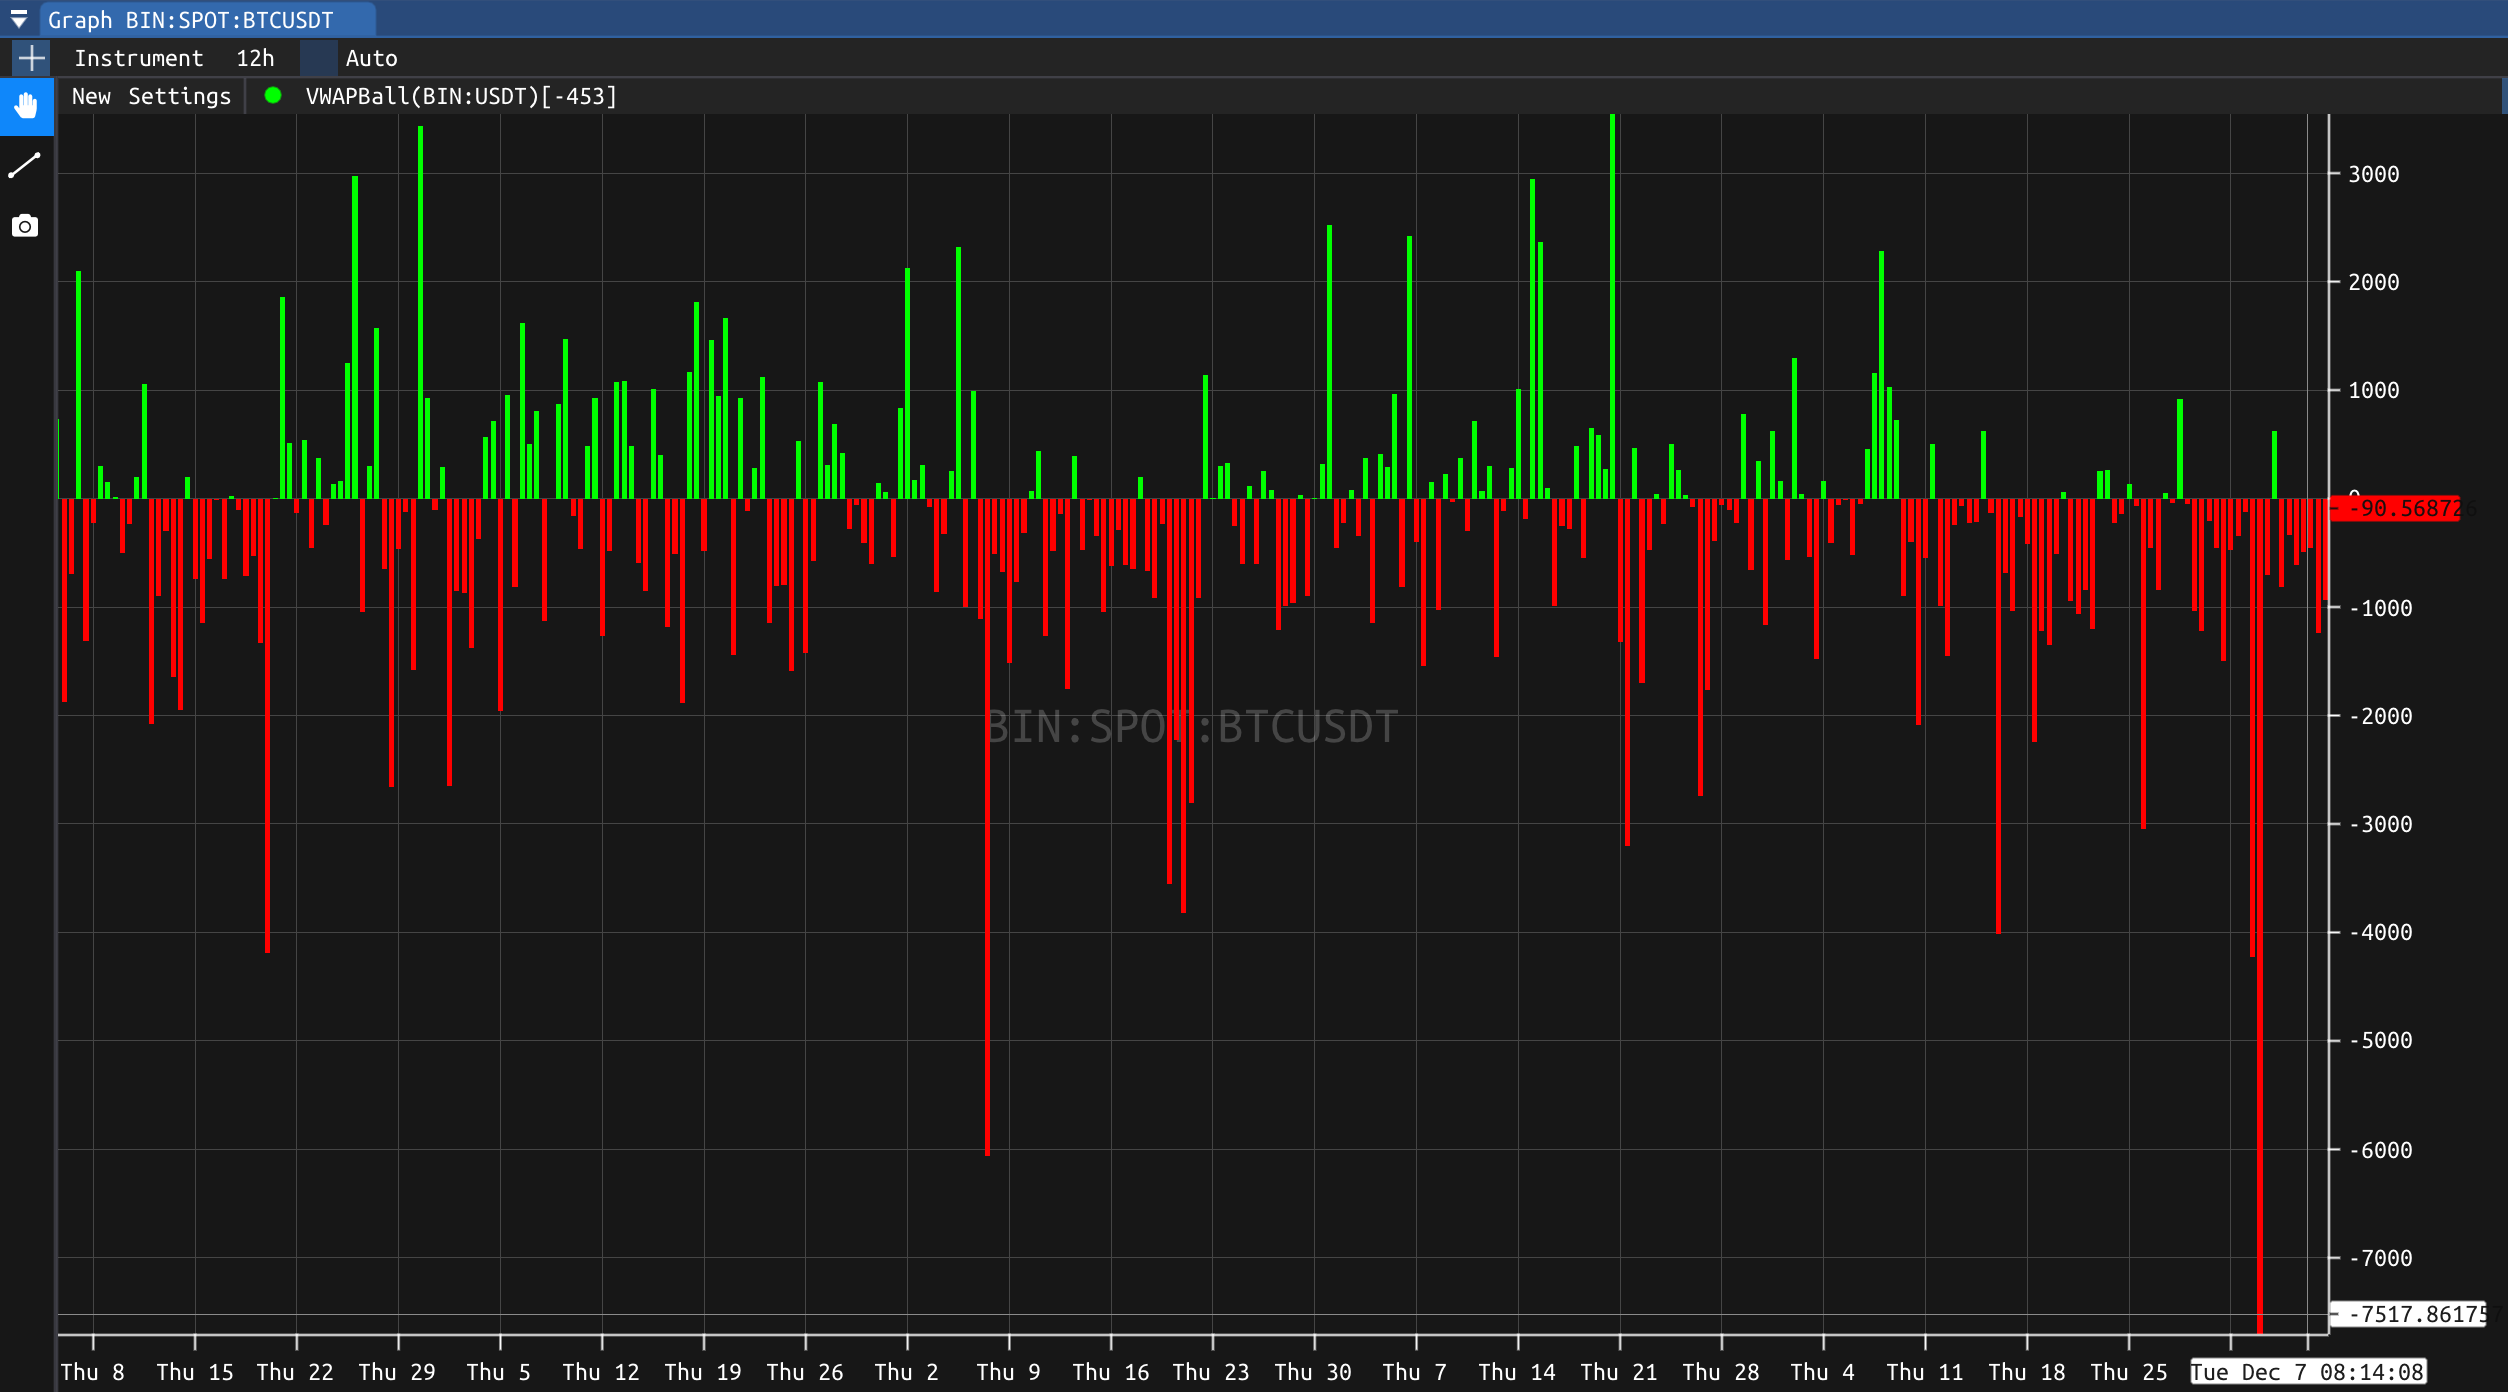
Net Volume Rotation
The Net Volume Rotation can be used to assess the evolution in selling or buying pressure through the accumulation of consecutive positive or negative Net Volume. 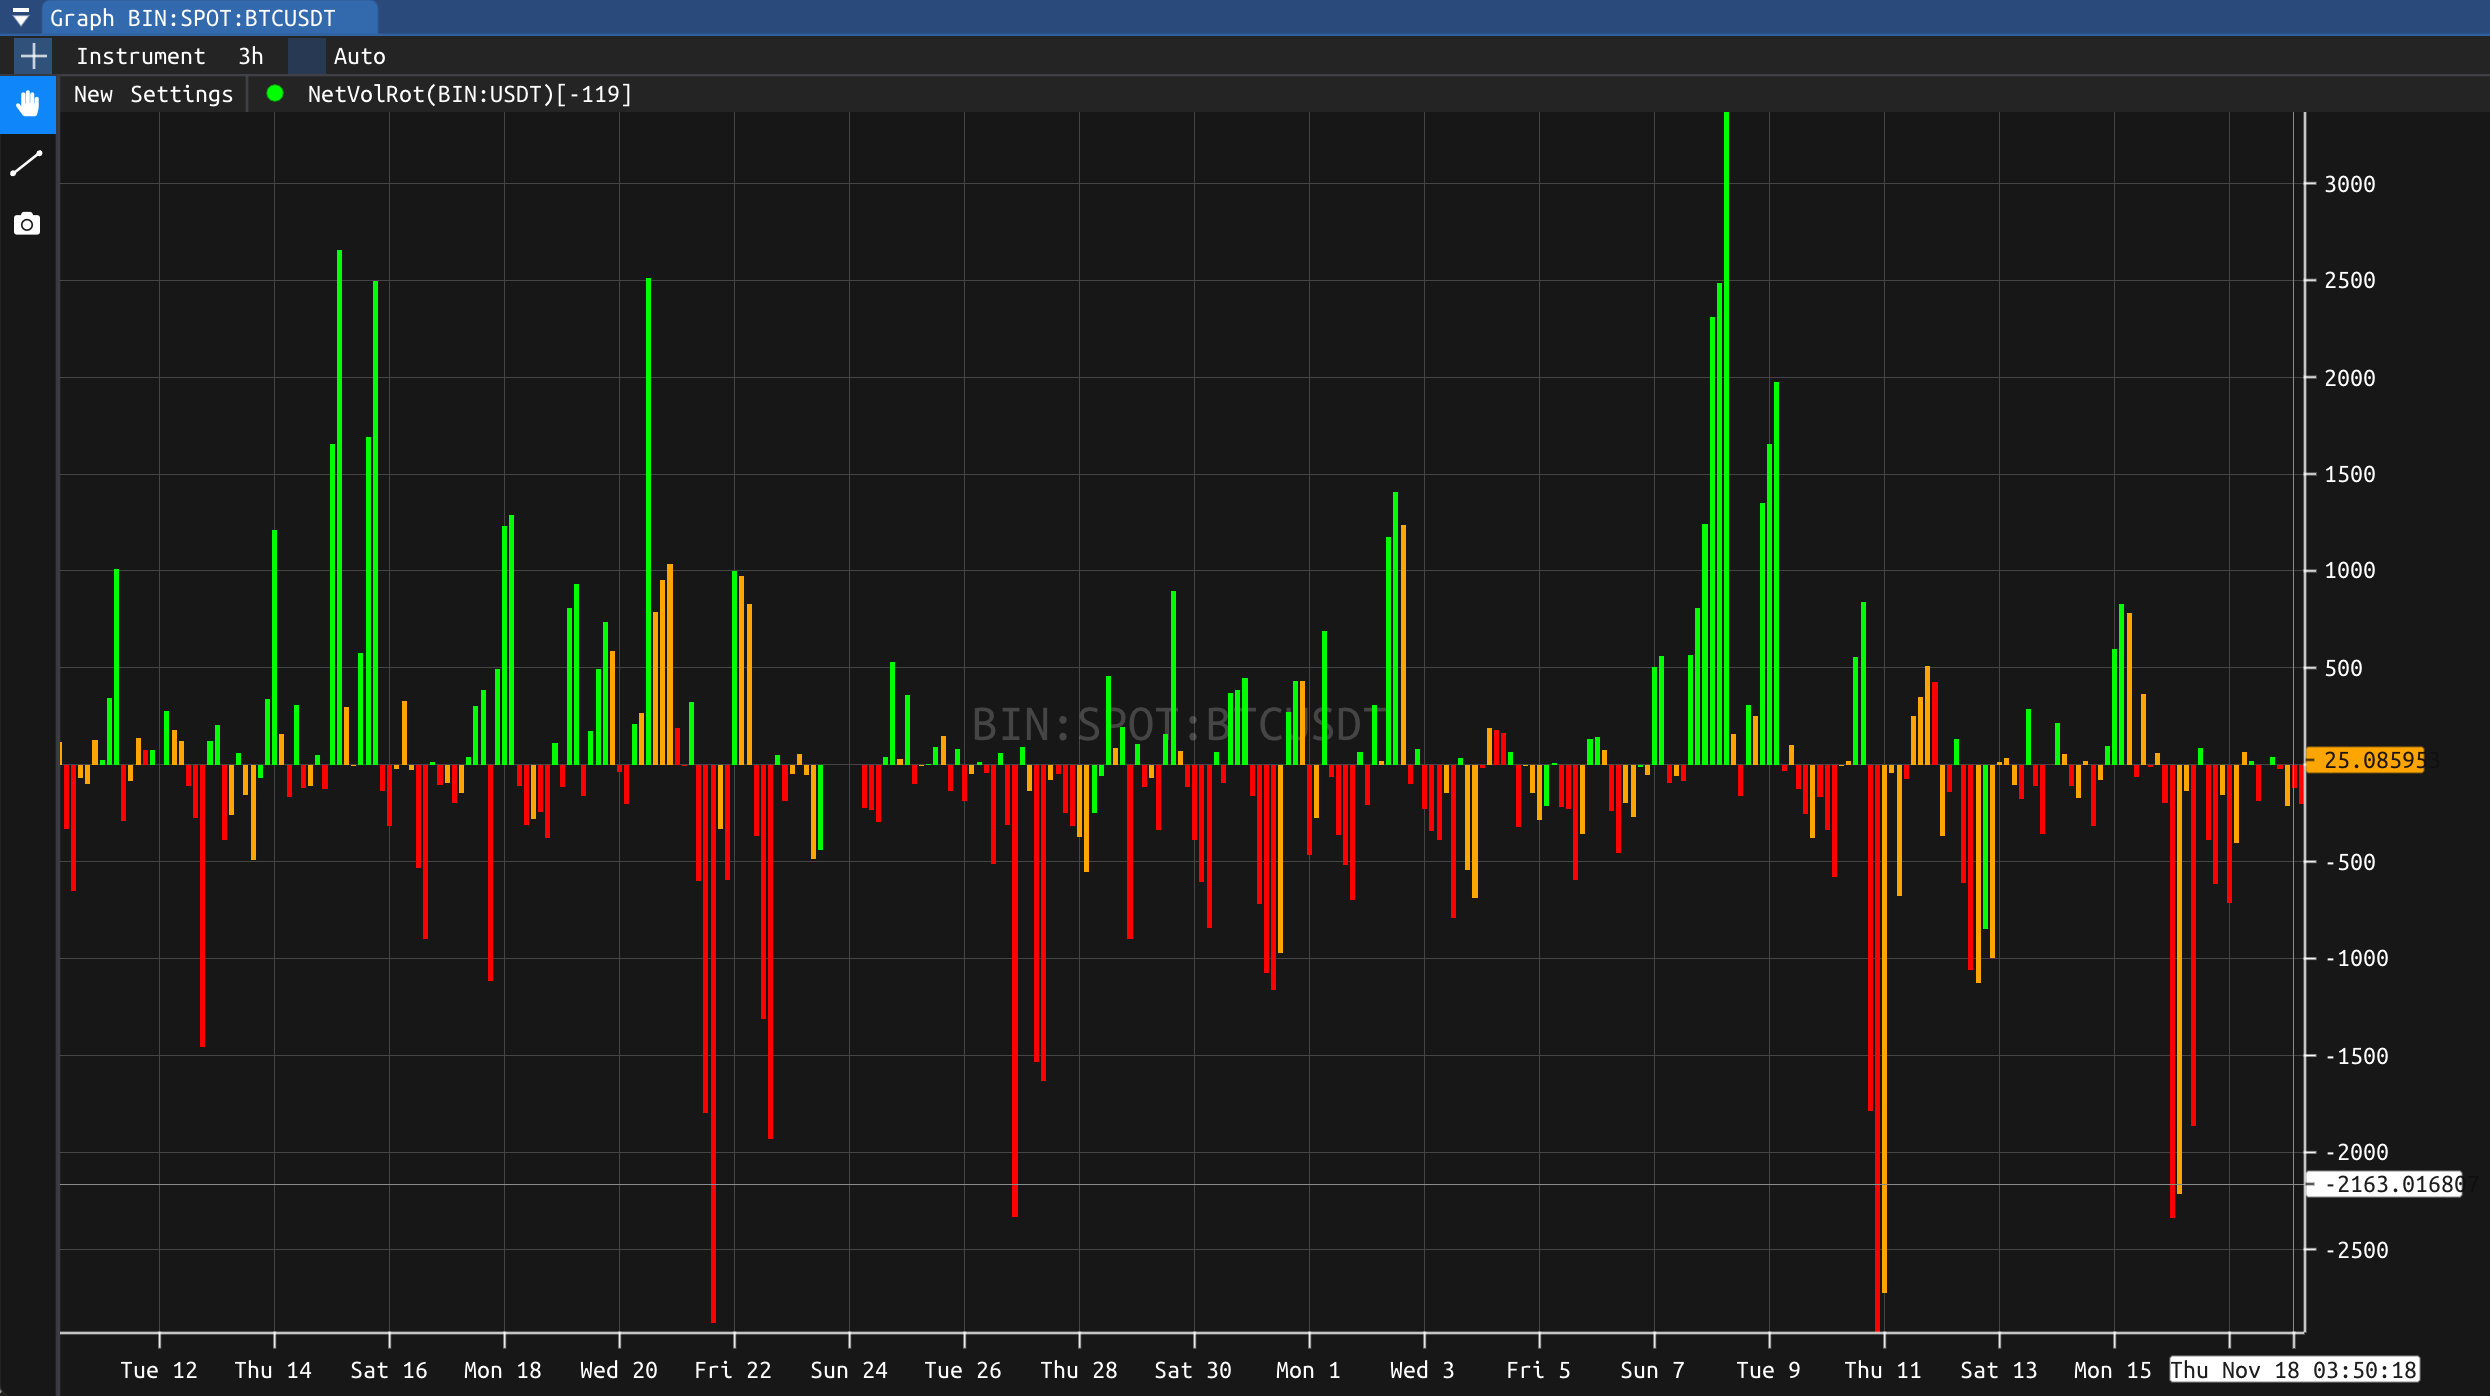
Trade Count
The Trade Count metric allows you to simply count the amount of buys, sells, buys + sells or buys - sells. 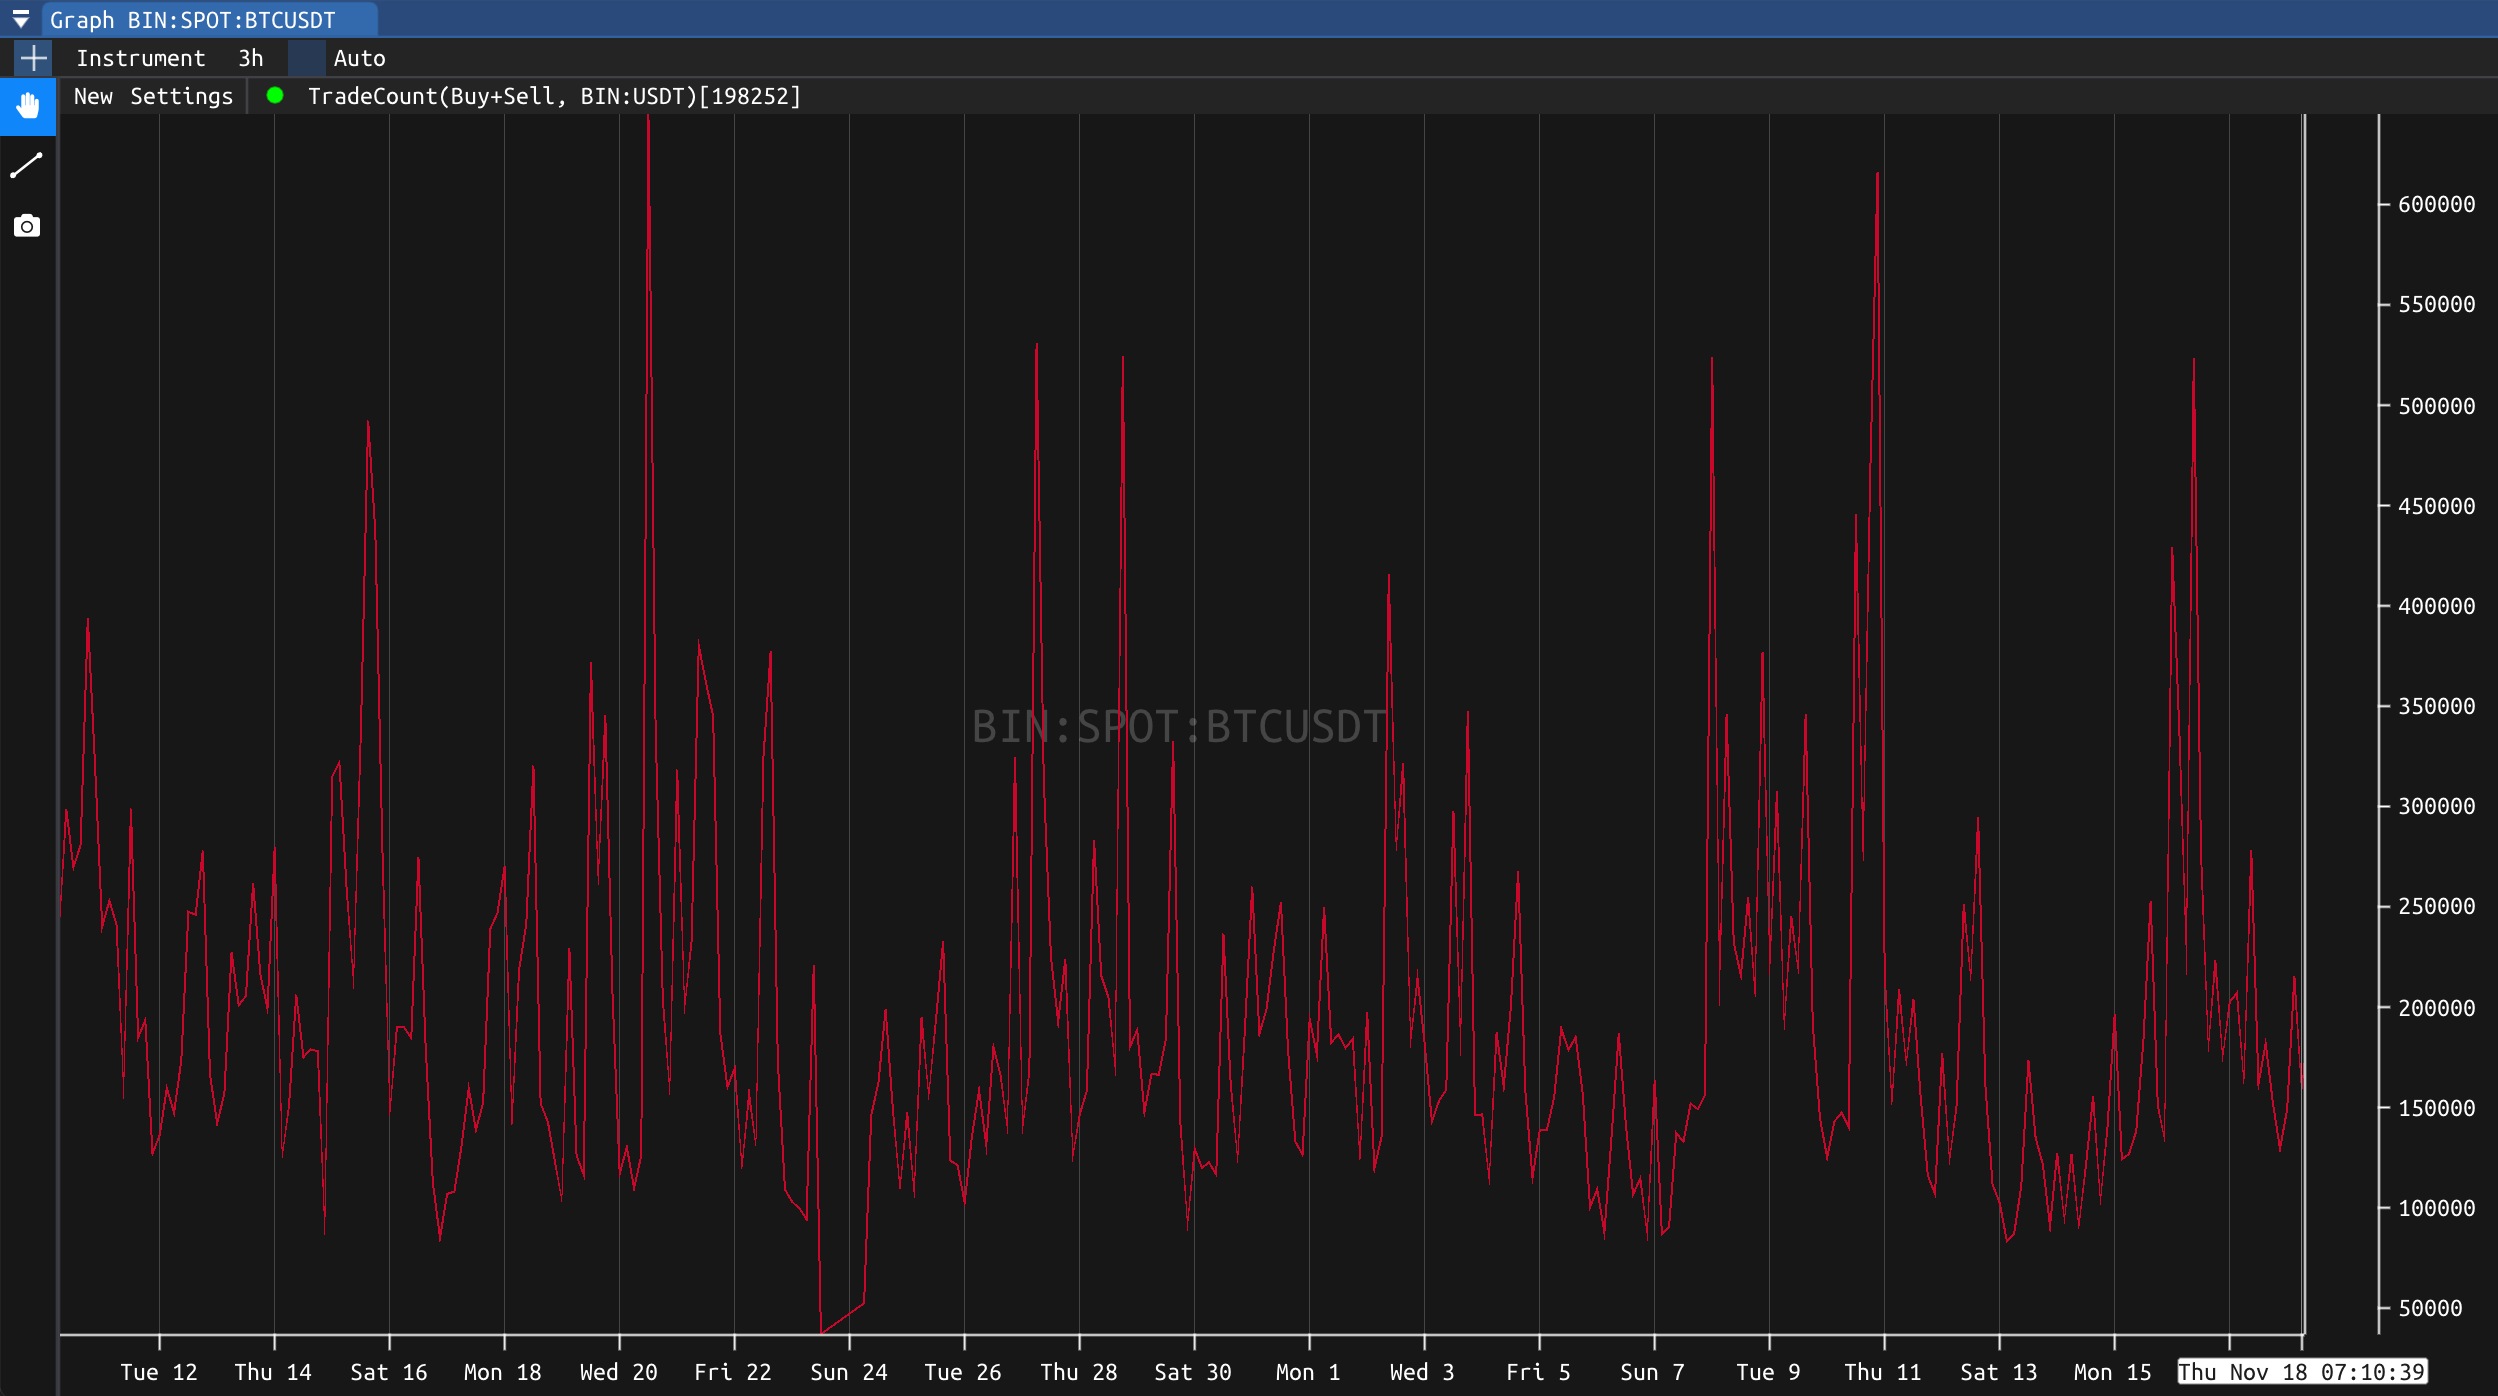
Cumulative Volume Delta
The Cumulative Volume Delta (CVD) displays a running total of the net volume being traded for the instrument pair. Any buy volume will be added to the accumulator, while sell volume will be subtracted from it. 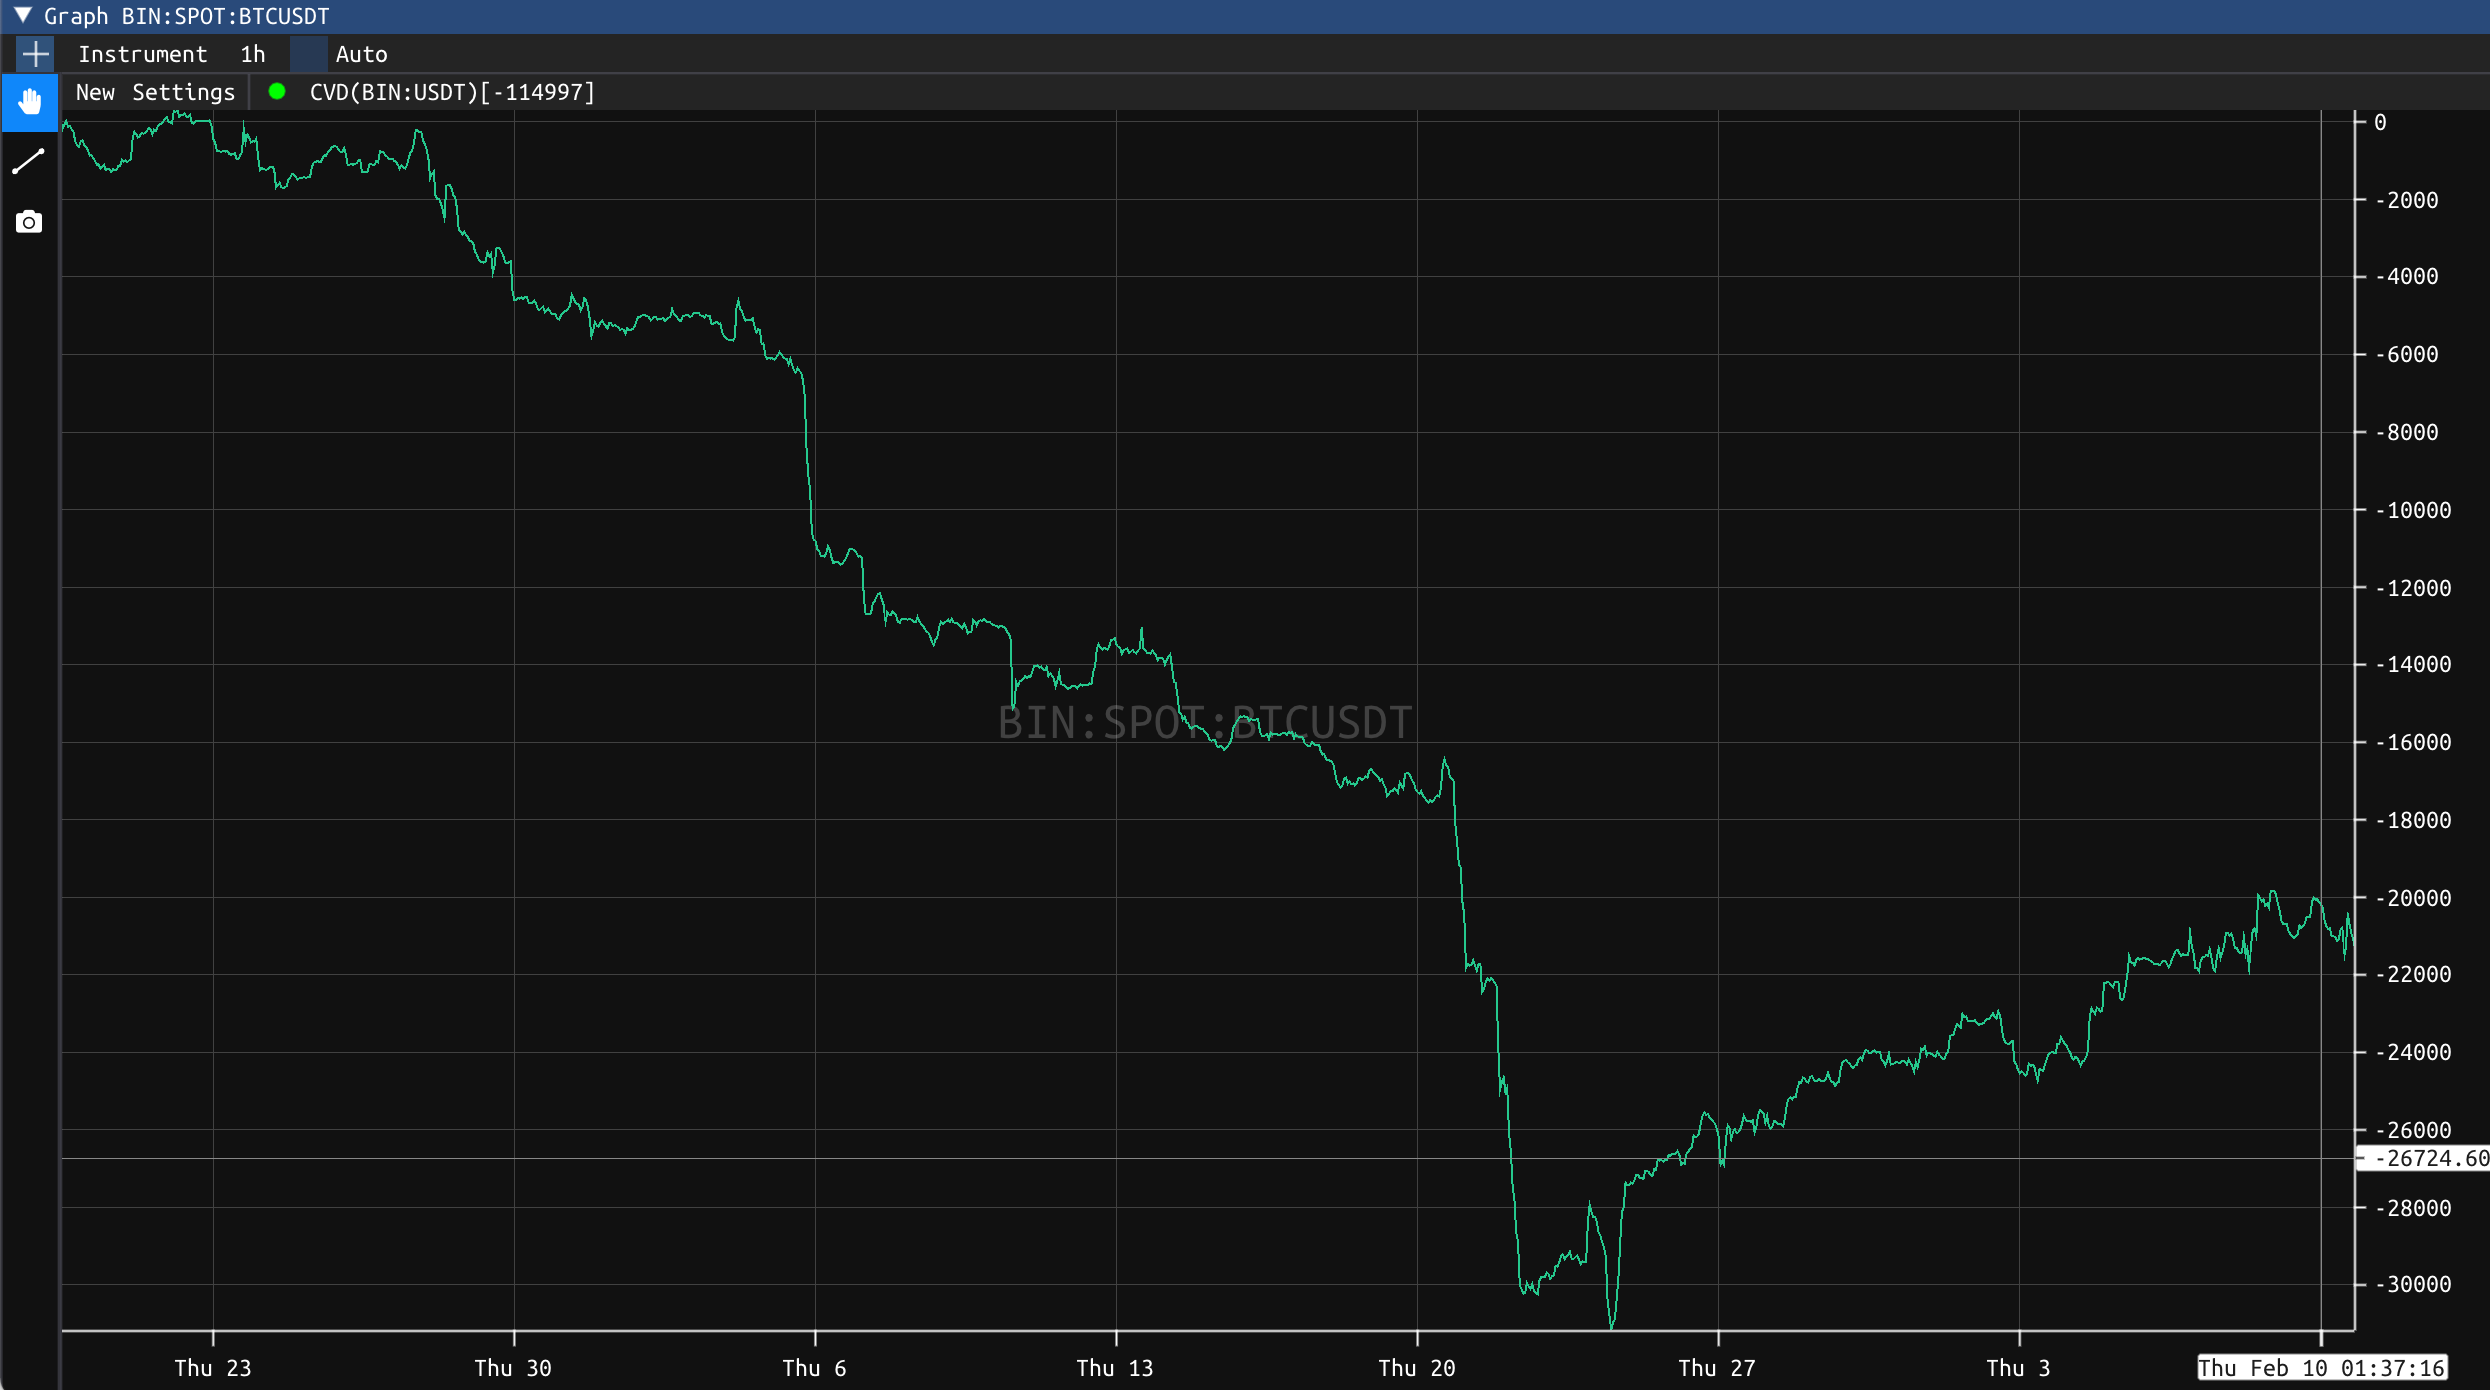
Cumulative Direction Delta
The Cumulative Direction Delta (CDD) displays a net sum of the direction of each candle for the instrument pair. Any green candle will add one to the accumulator, while a red candle will subsctract one to the accumulator. 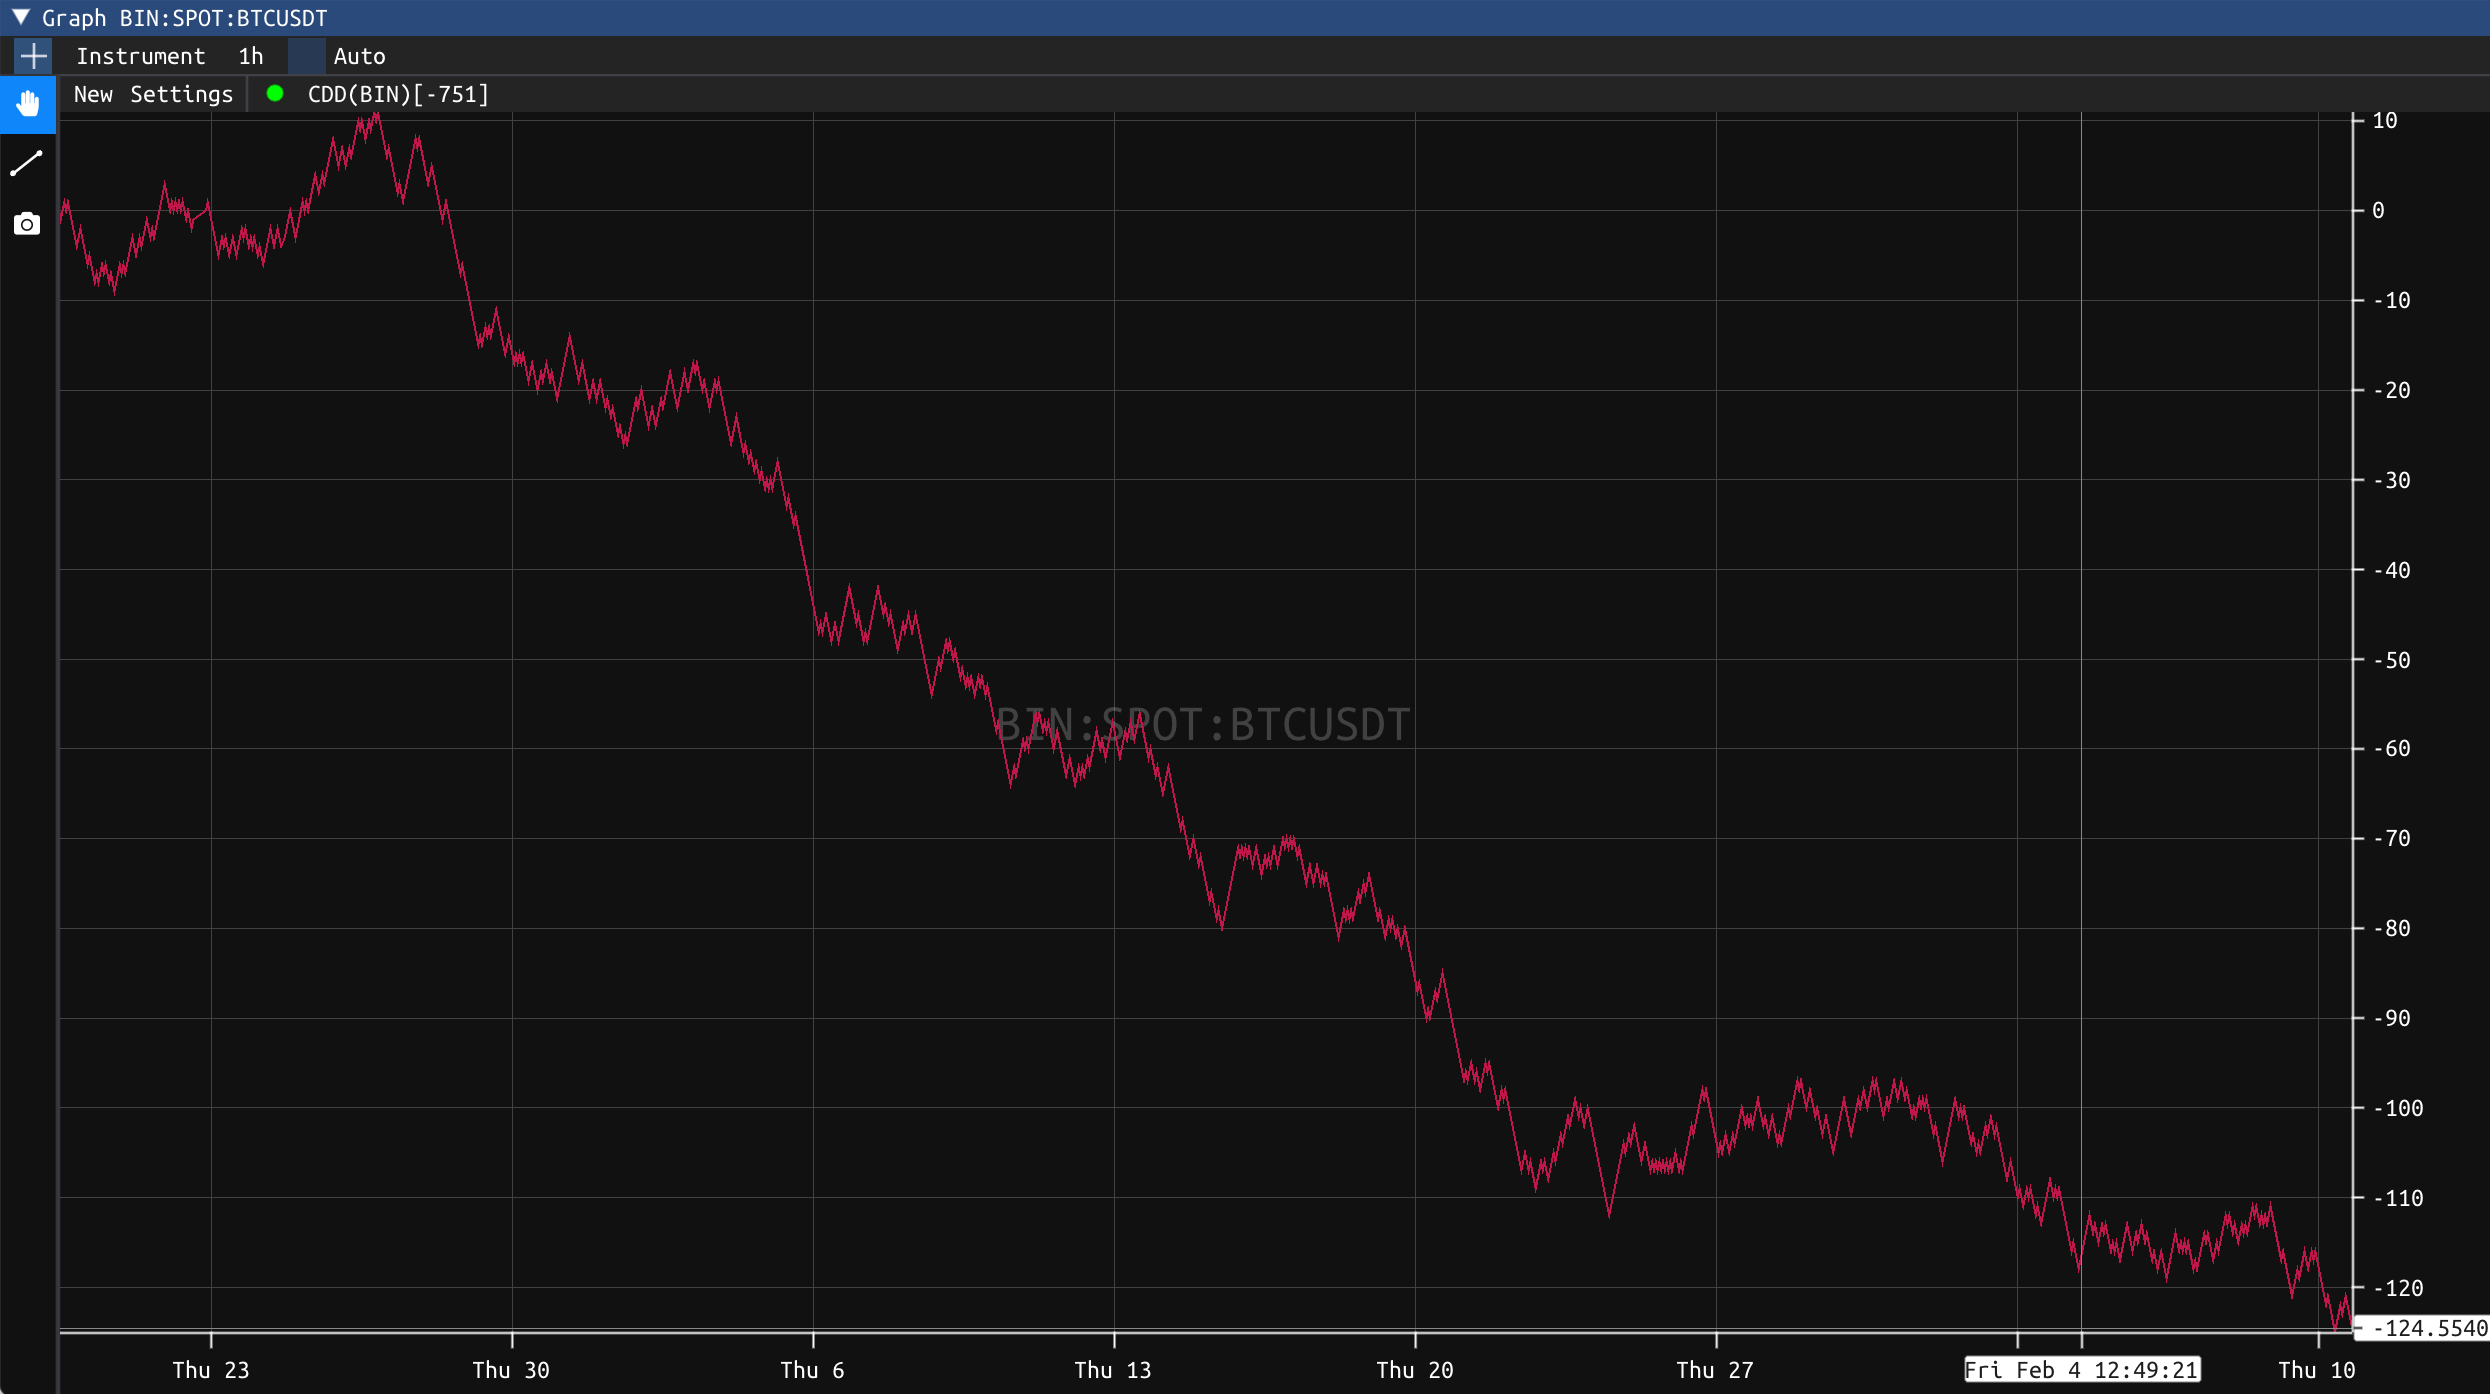
Trade Intensity Imbalance
The Trade Intensity Imbalance (TII) displays the imbalance in the intensity of buy and sell trades, independent of their volume If there is a high amount of buy taker orders, compared to sell taker orders, the indicator will be high. Inversely, if there is a high amount of sell taker orders compared to buy taker orders, the indicator will be low. 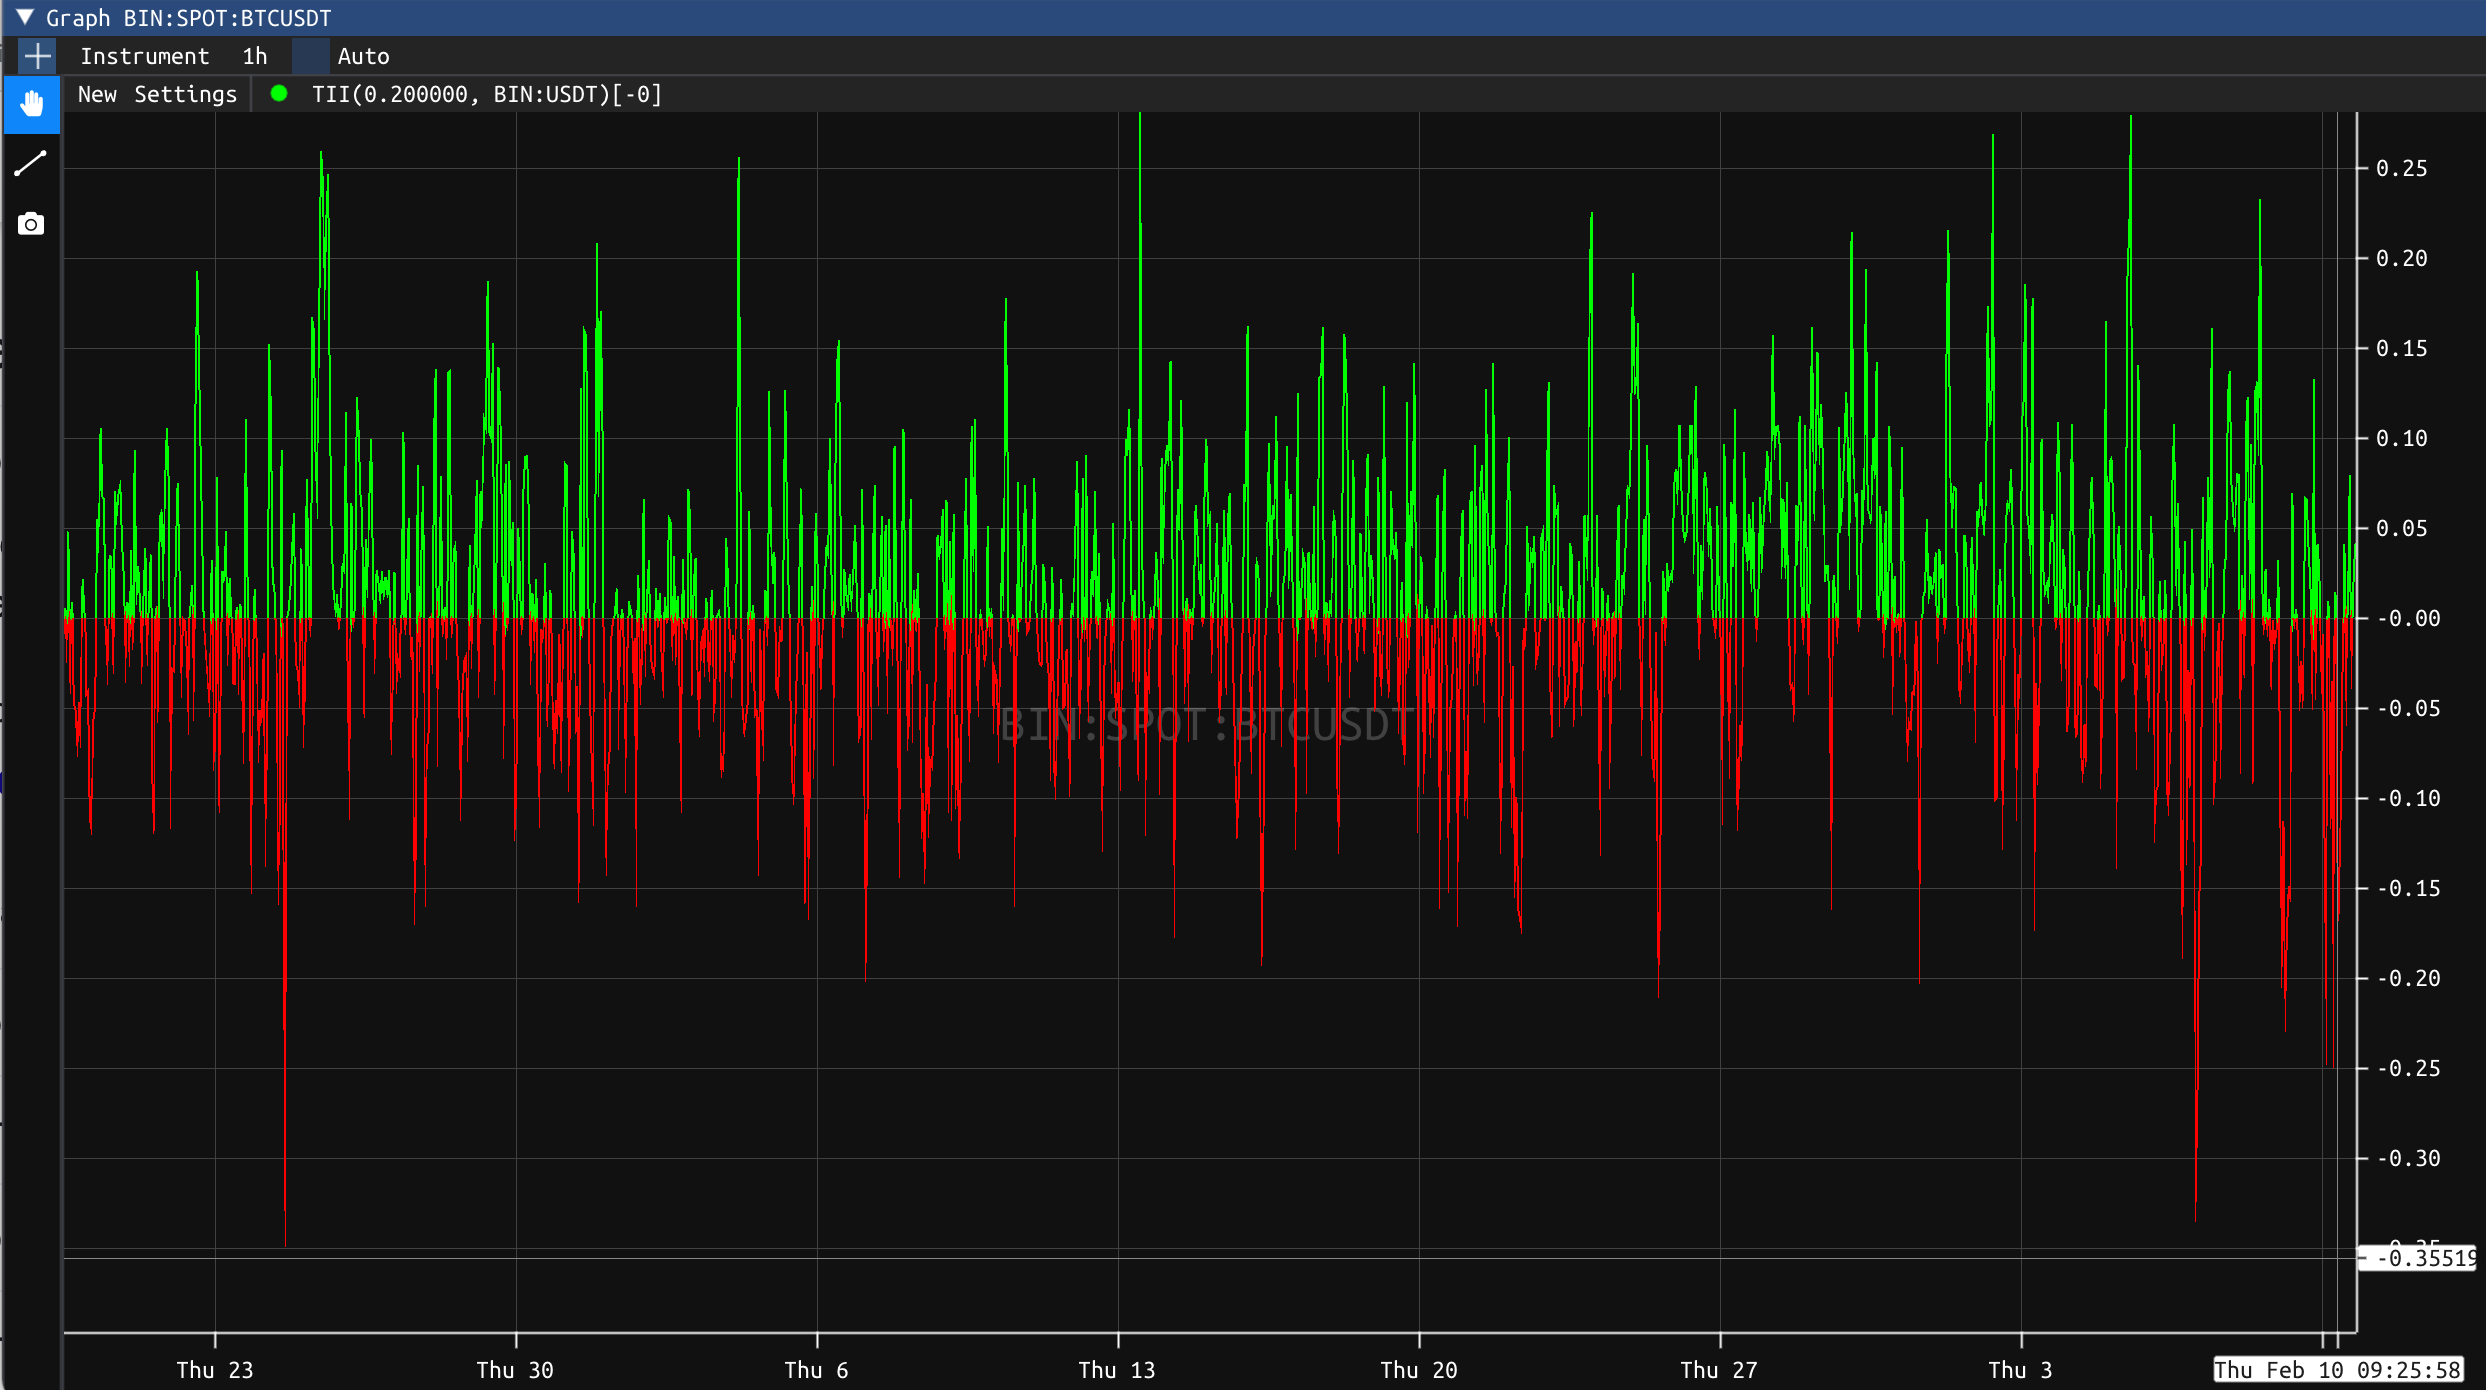
Trade Flow Imbalance
The Trade Intensity Imbalance (TFI) displays the imbalance in the intensity of buy and sell trades, independent of their volume If there is a high amount of buy taker orders, compared to sell taker orders, the indicator will be high. Inversely, if there is a high amount of sell taker orders compared to buy taker orders, the indicator will be low. 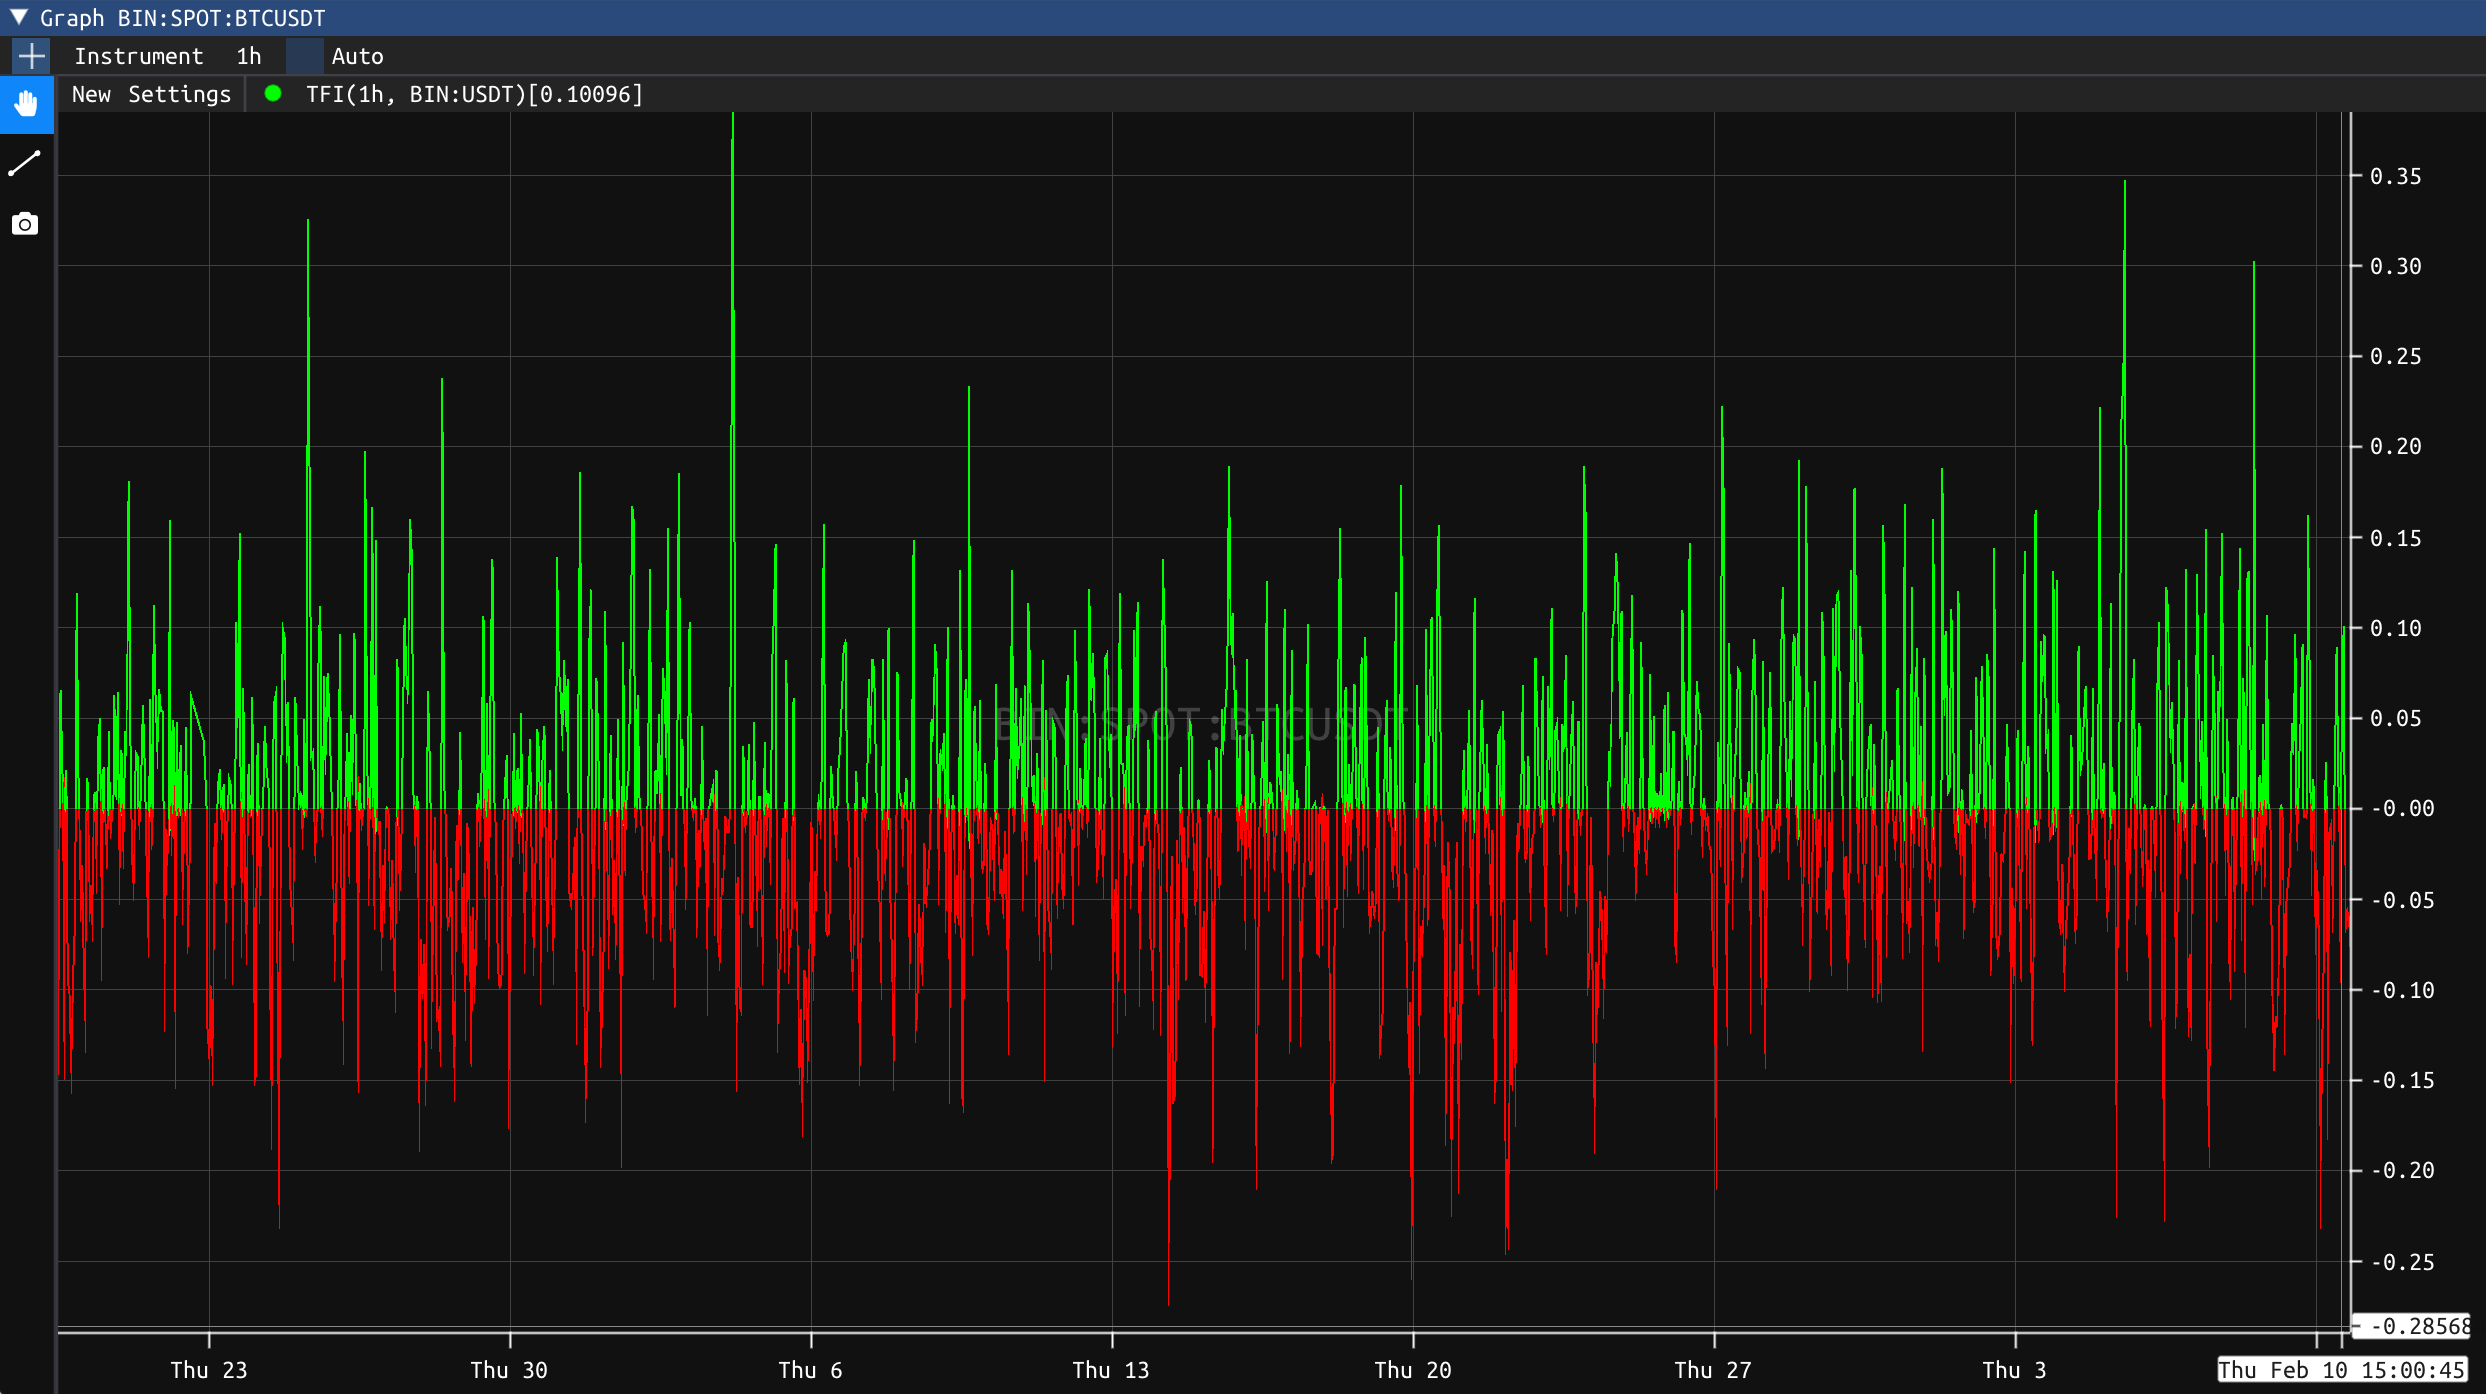
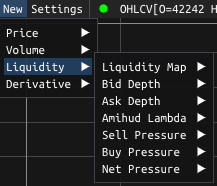
Liquidity
Liquidity Map
The Liquidity Map can be used to display the buy and sell orders placed for the instrument on various exchanges. It's an easy way to notice any resistance or support for the asset, as can be seen on the image below with a strong resistance for the pair. The depth parameter for the liquidity map can be used in order to fix the range over which the map will be displayed (in percentage of the mid price). 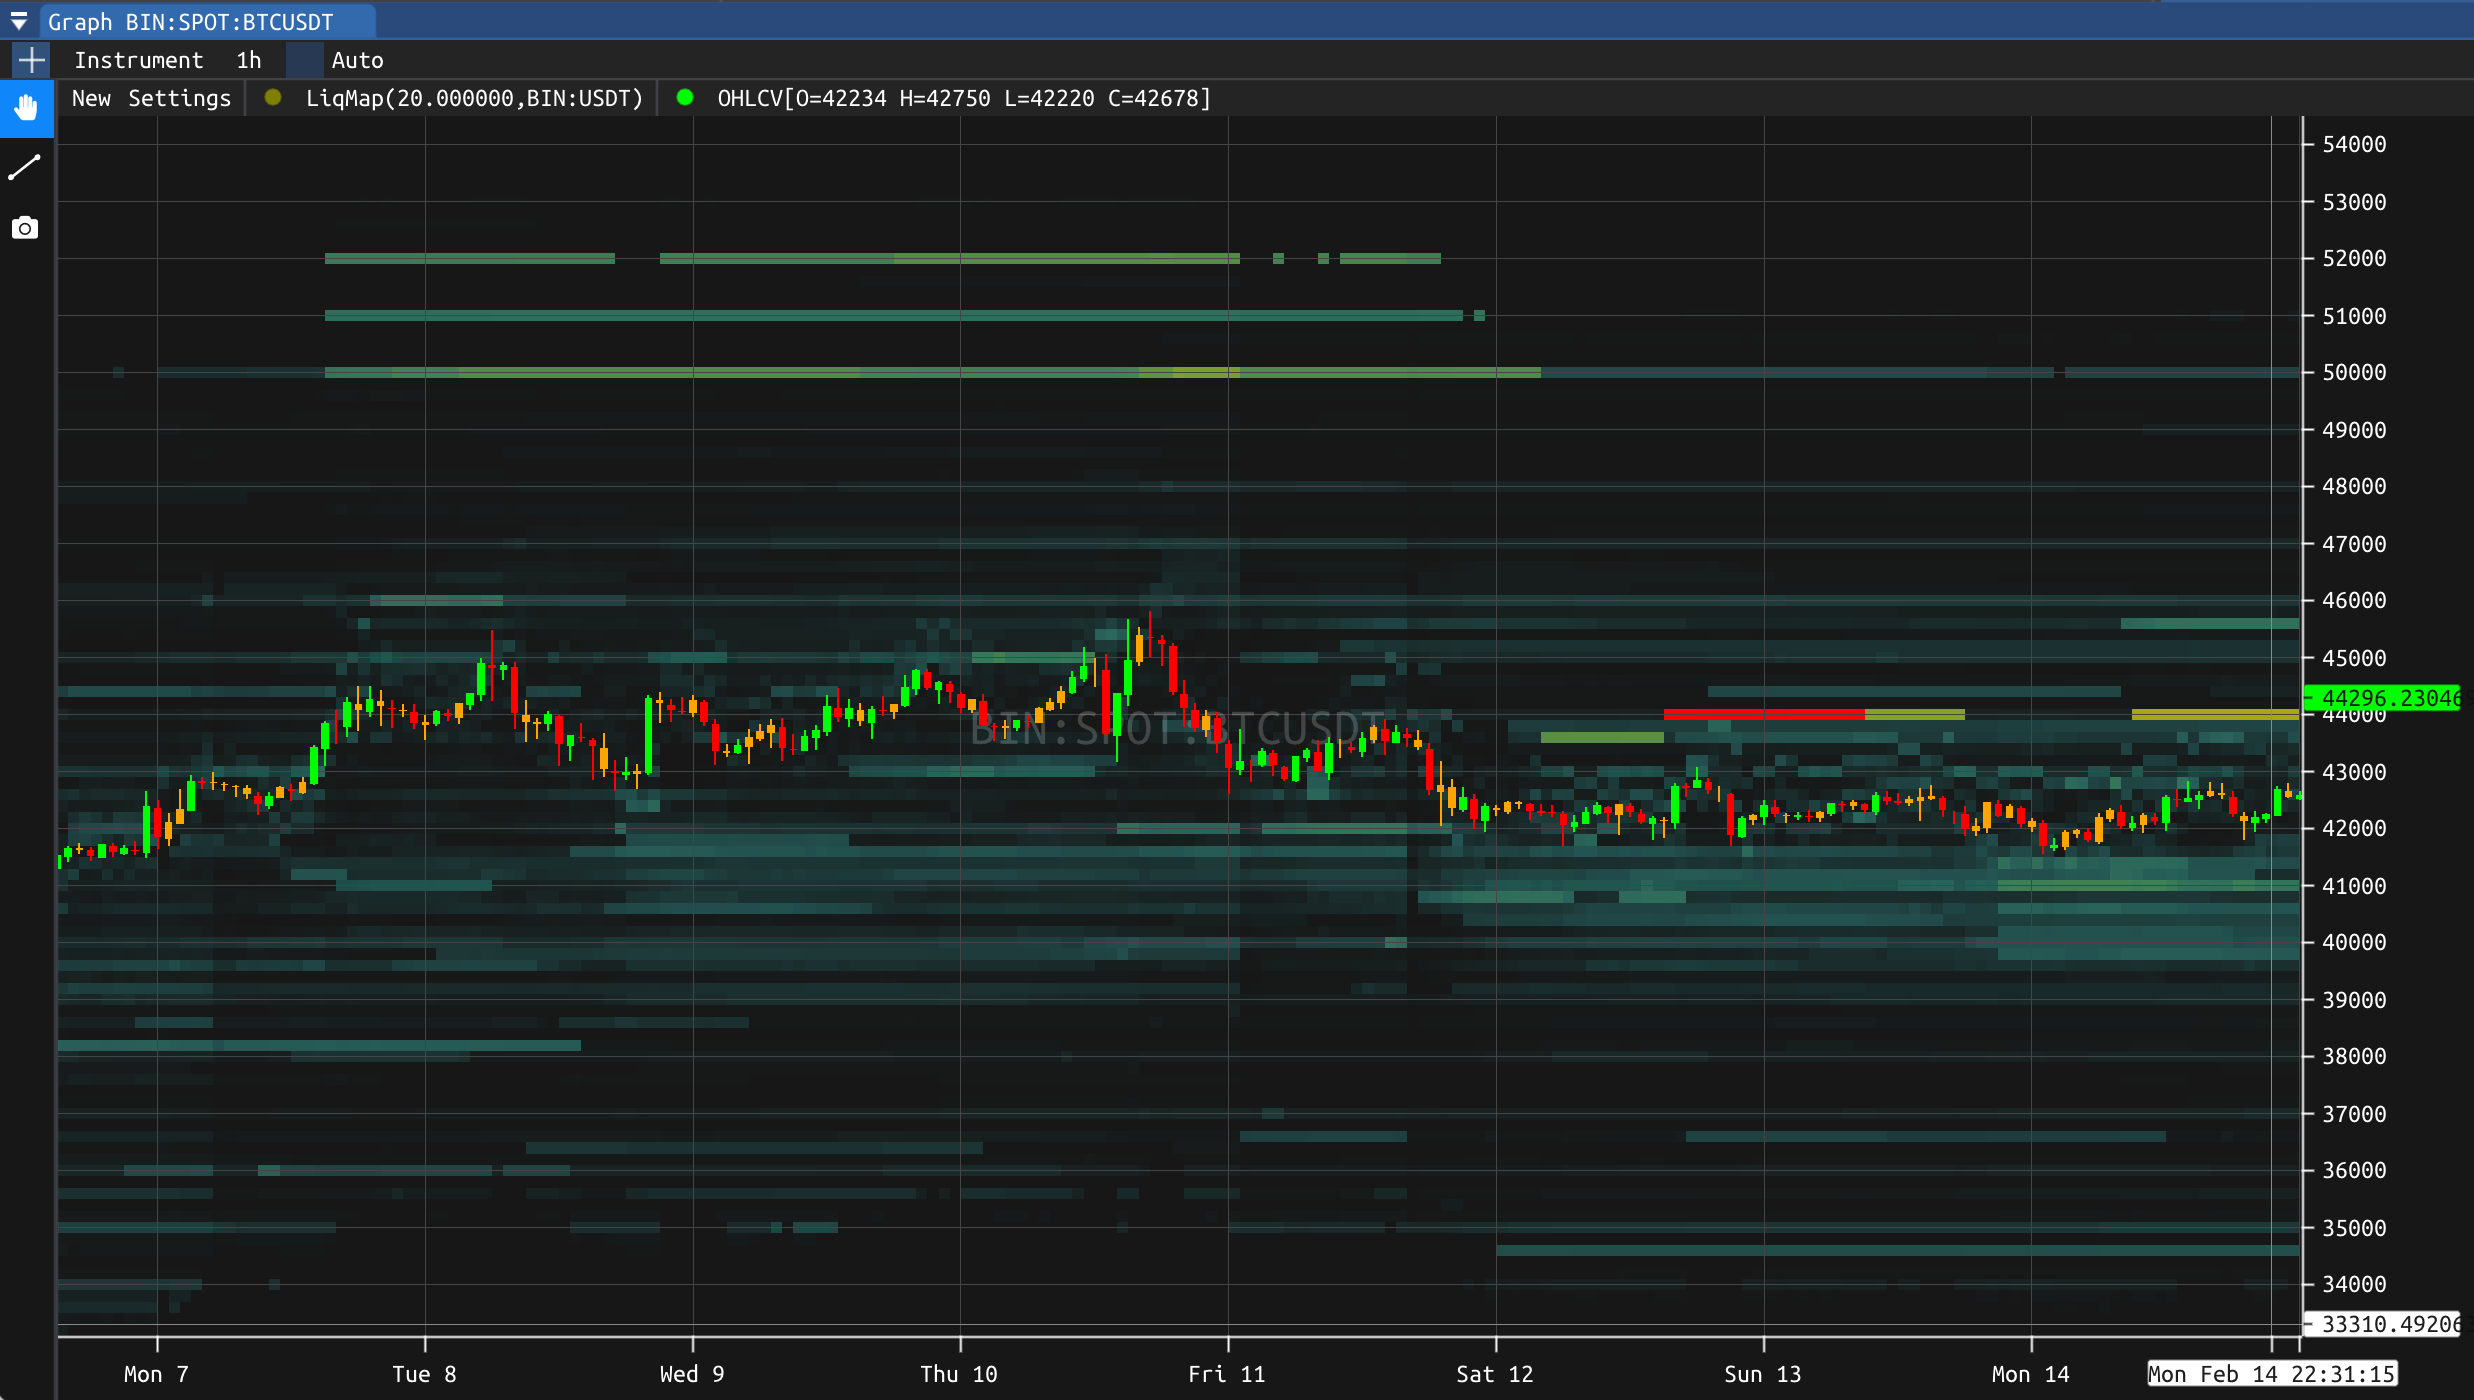
Bid Depth
The Bid Depth is the total amount of bids on the current market for the selected exchange. As previously, the depth parameter can be used in order to fix the range over which the bids will be accounted for in the computation of the depth. 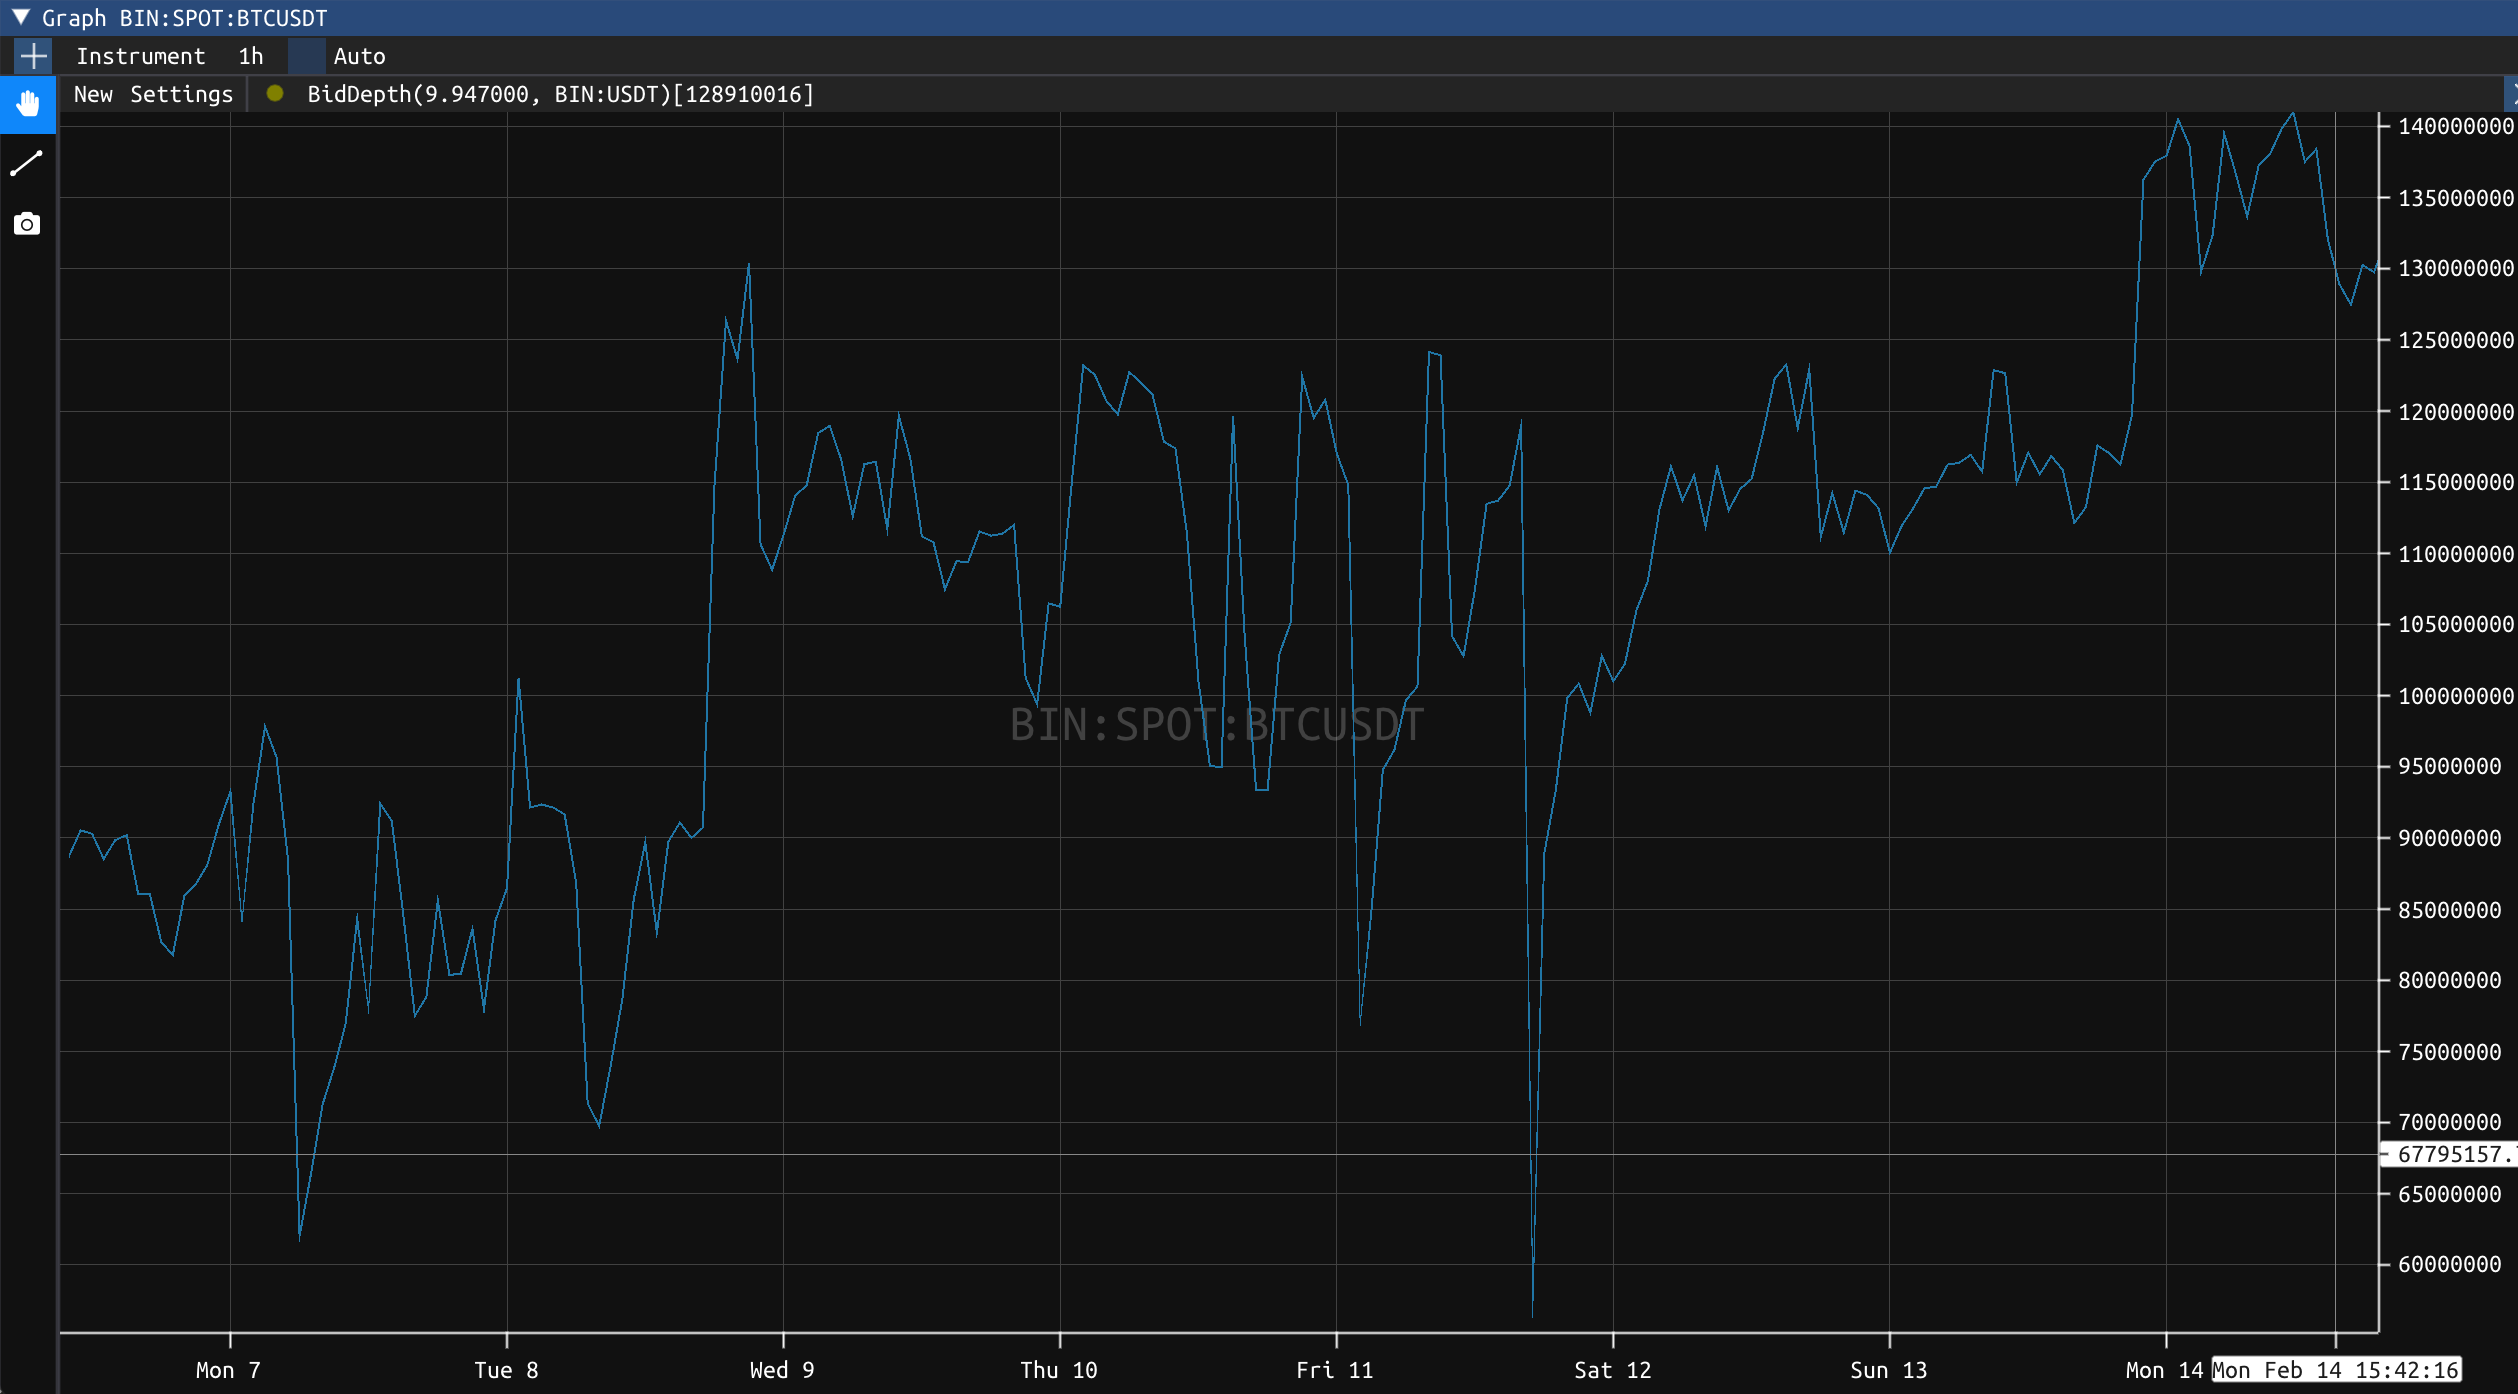
Ask Depth
The Ask Depth is the total amount of asks on the current market for the selected exchange. As previously, the depth parameter can be used in order to fix the range over which the asks will be accounted for in the computation of the depth. 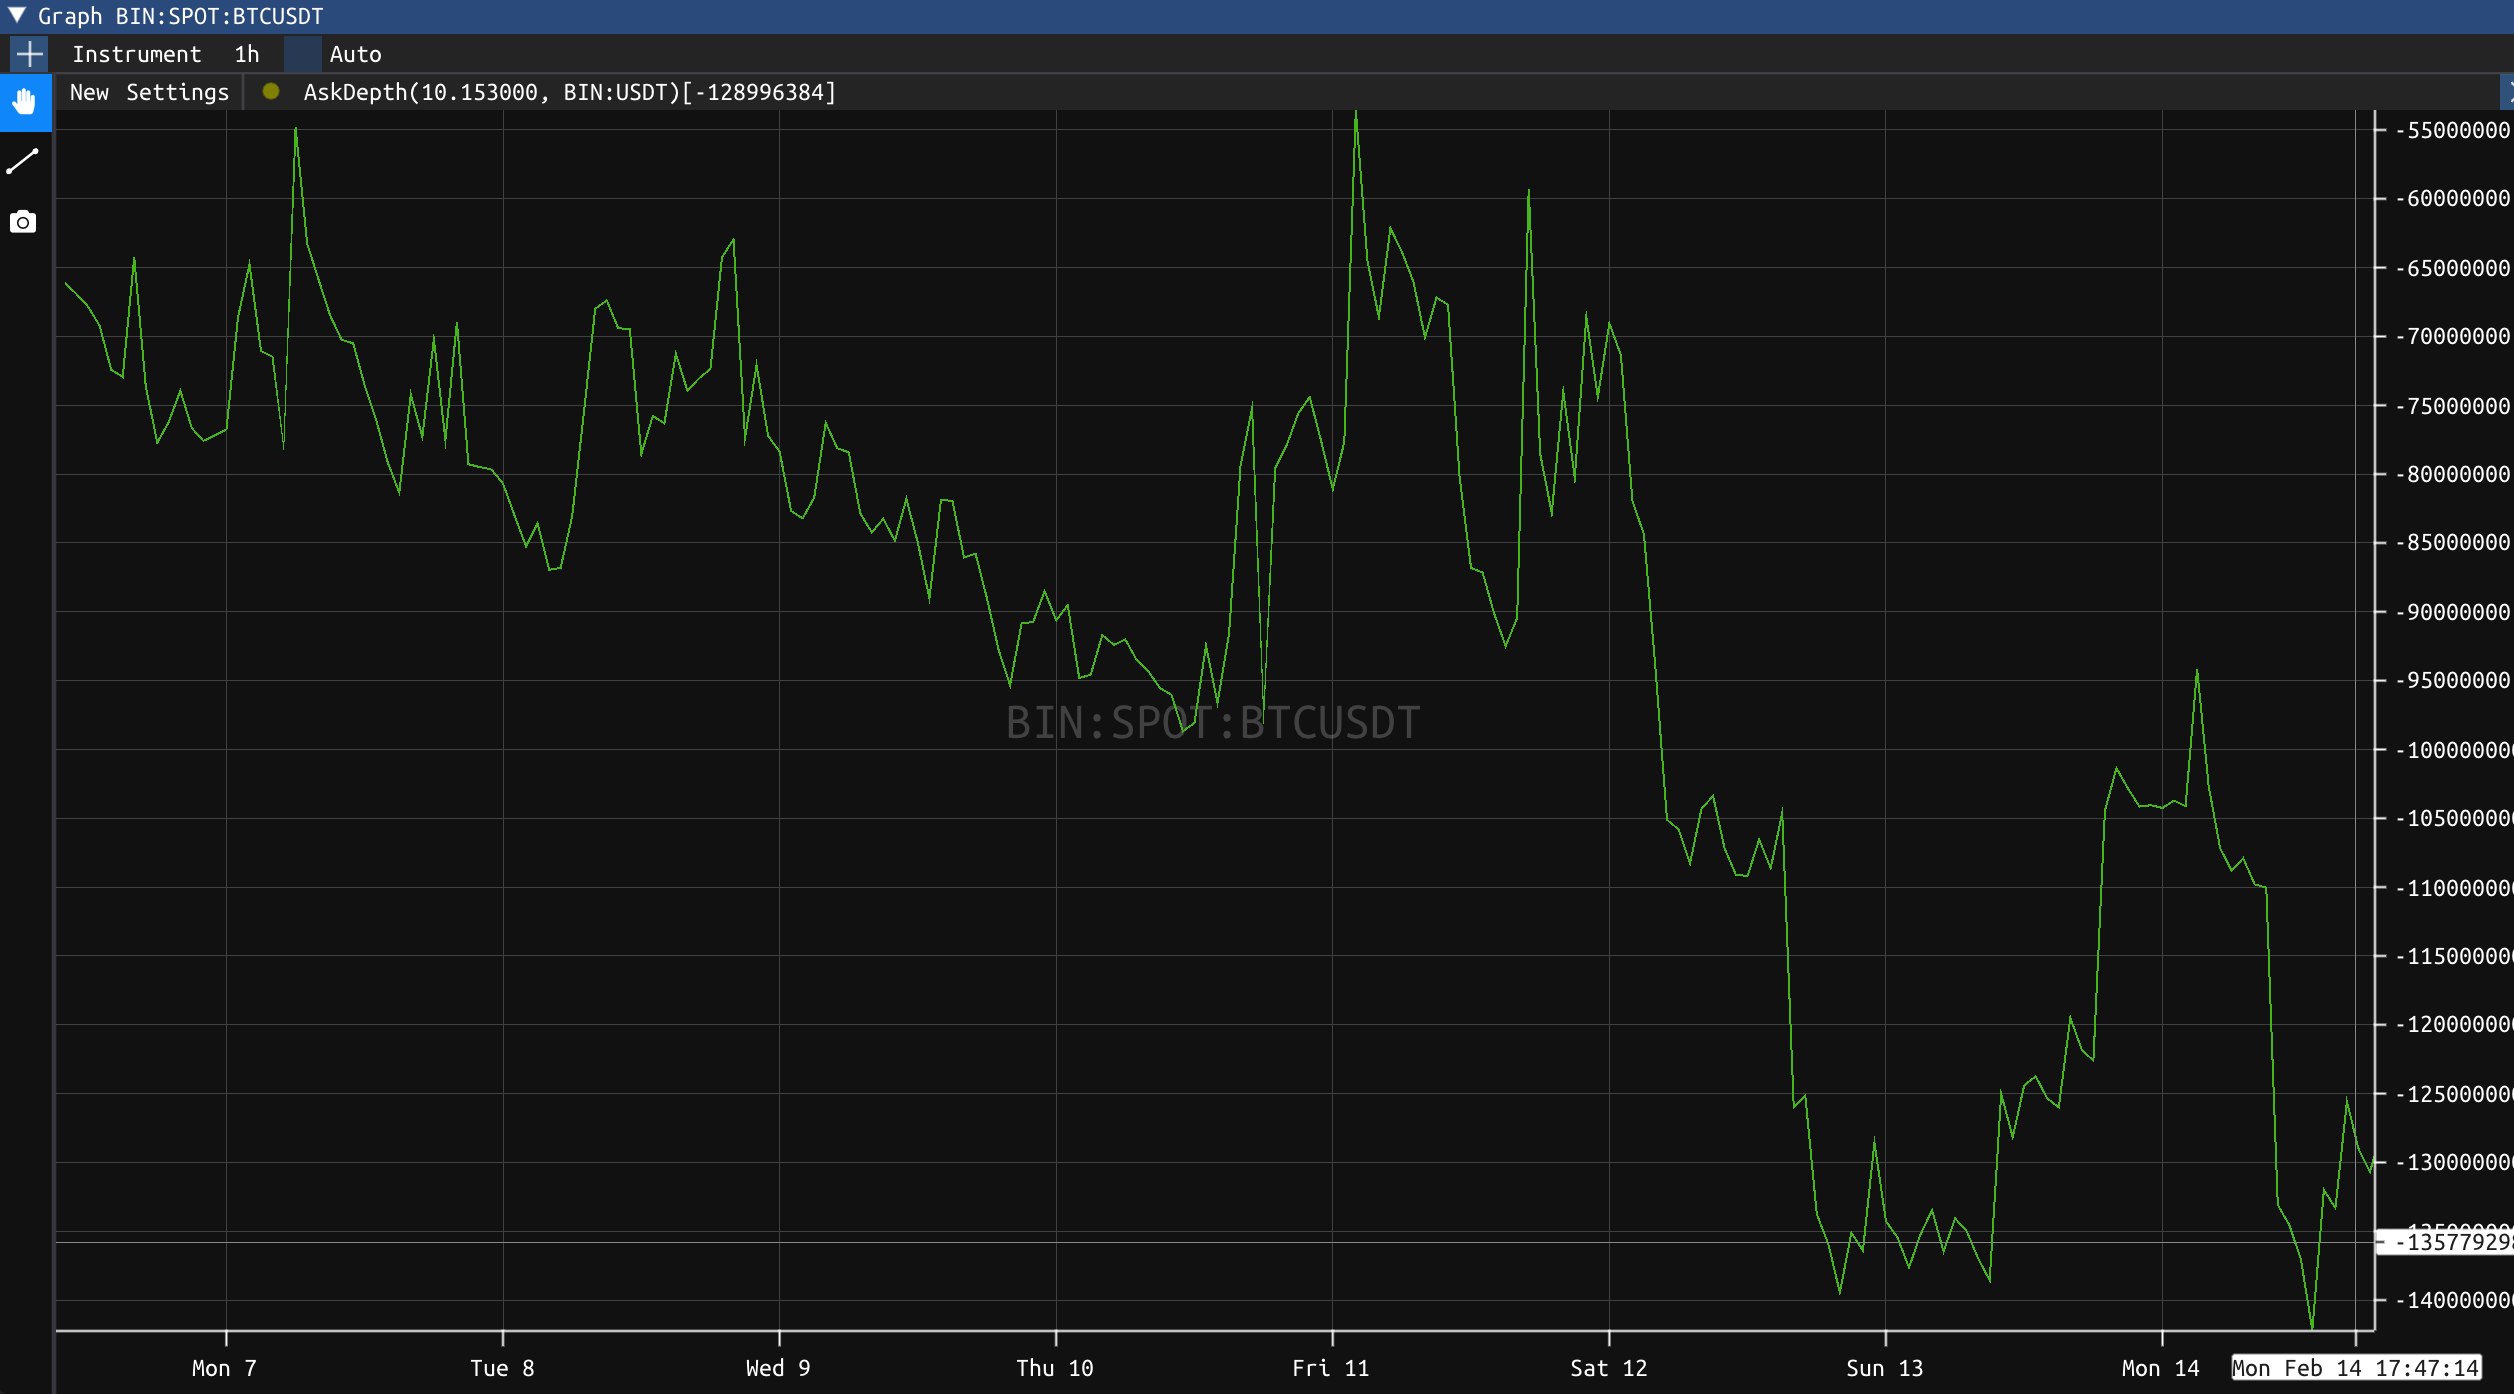
Amihud Lambda
The Amihud Lambda is a metric named after Yakov Amihud, and is an indication of the relationship between return and liquidity. More precisely, this metric computes the daily price response associated with one dollar of trading, allowing for an indication of the price impact. As previously, the half-life parameter will allow you to apply a smoothing effect on the data: the longer the half-life parameter, the more data will be included in the Amihud Lambda computation. 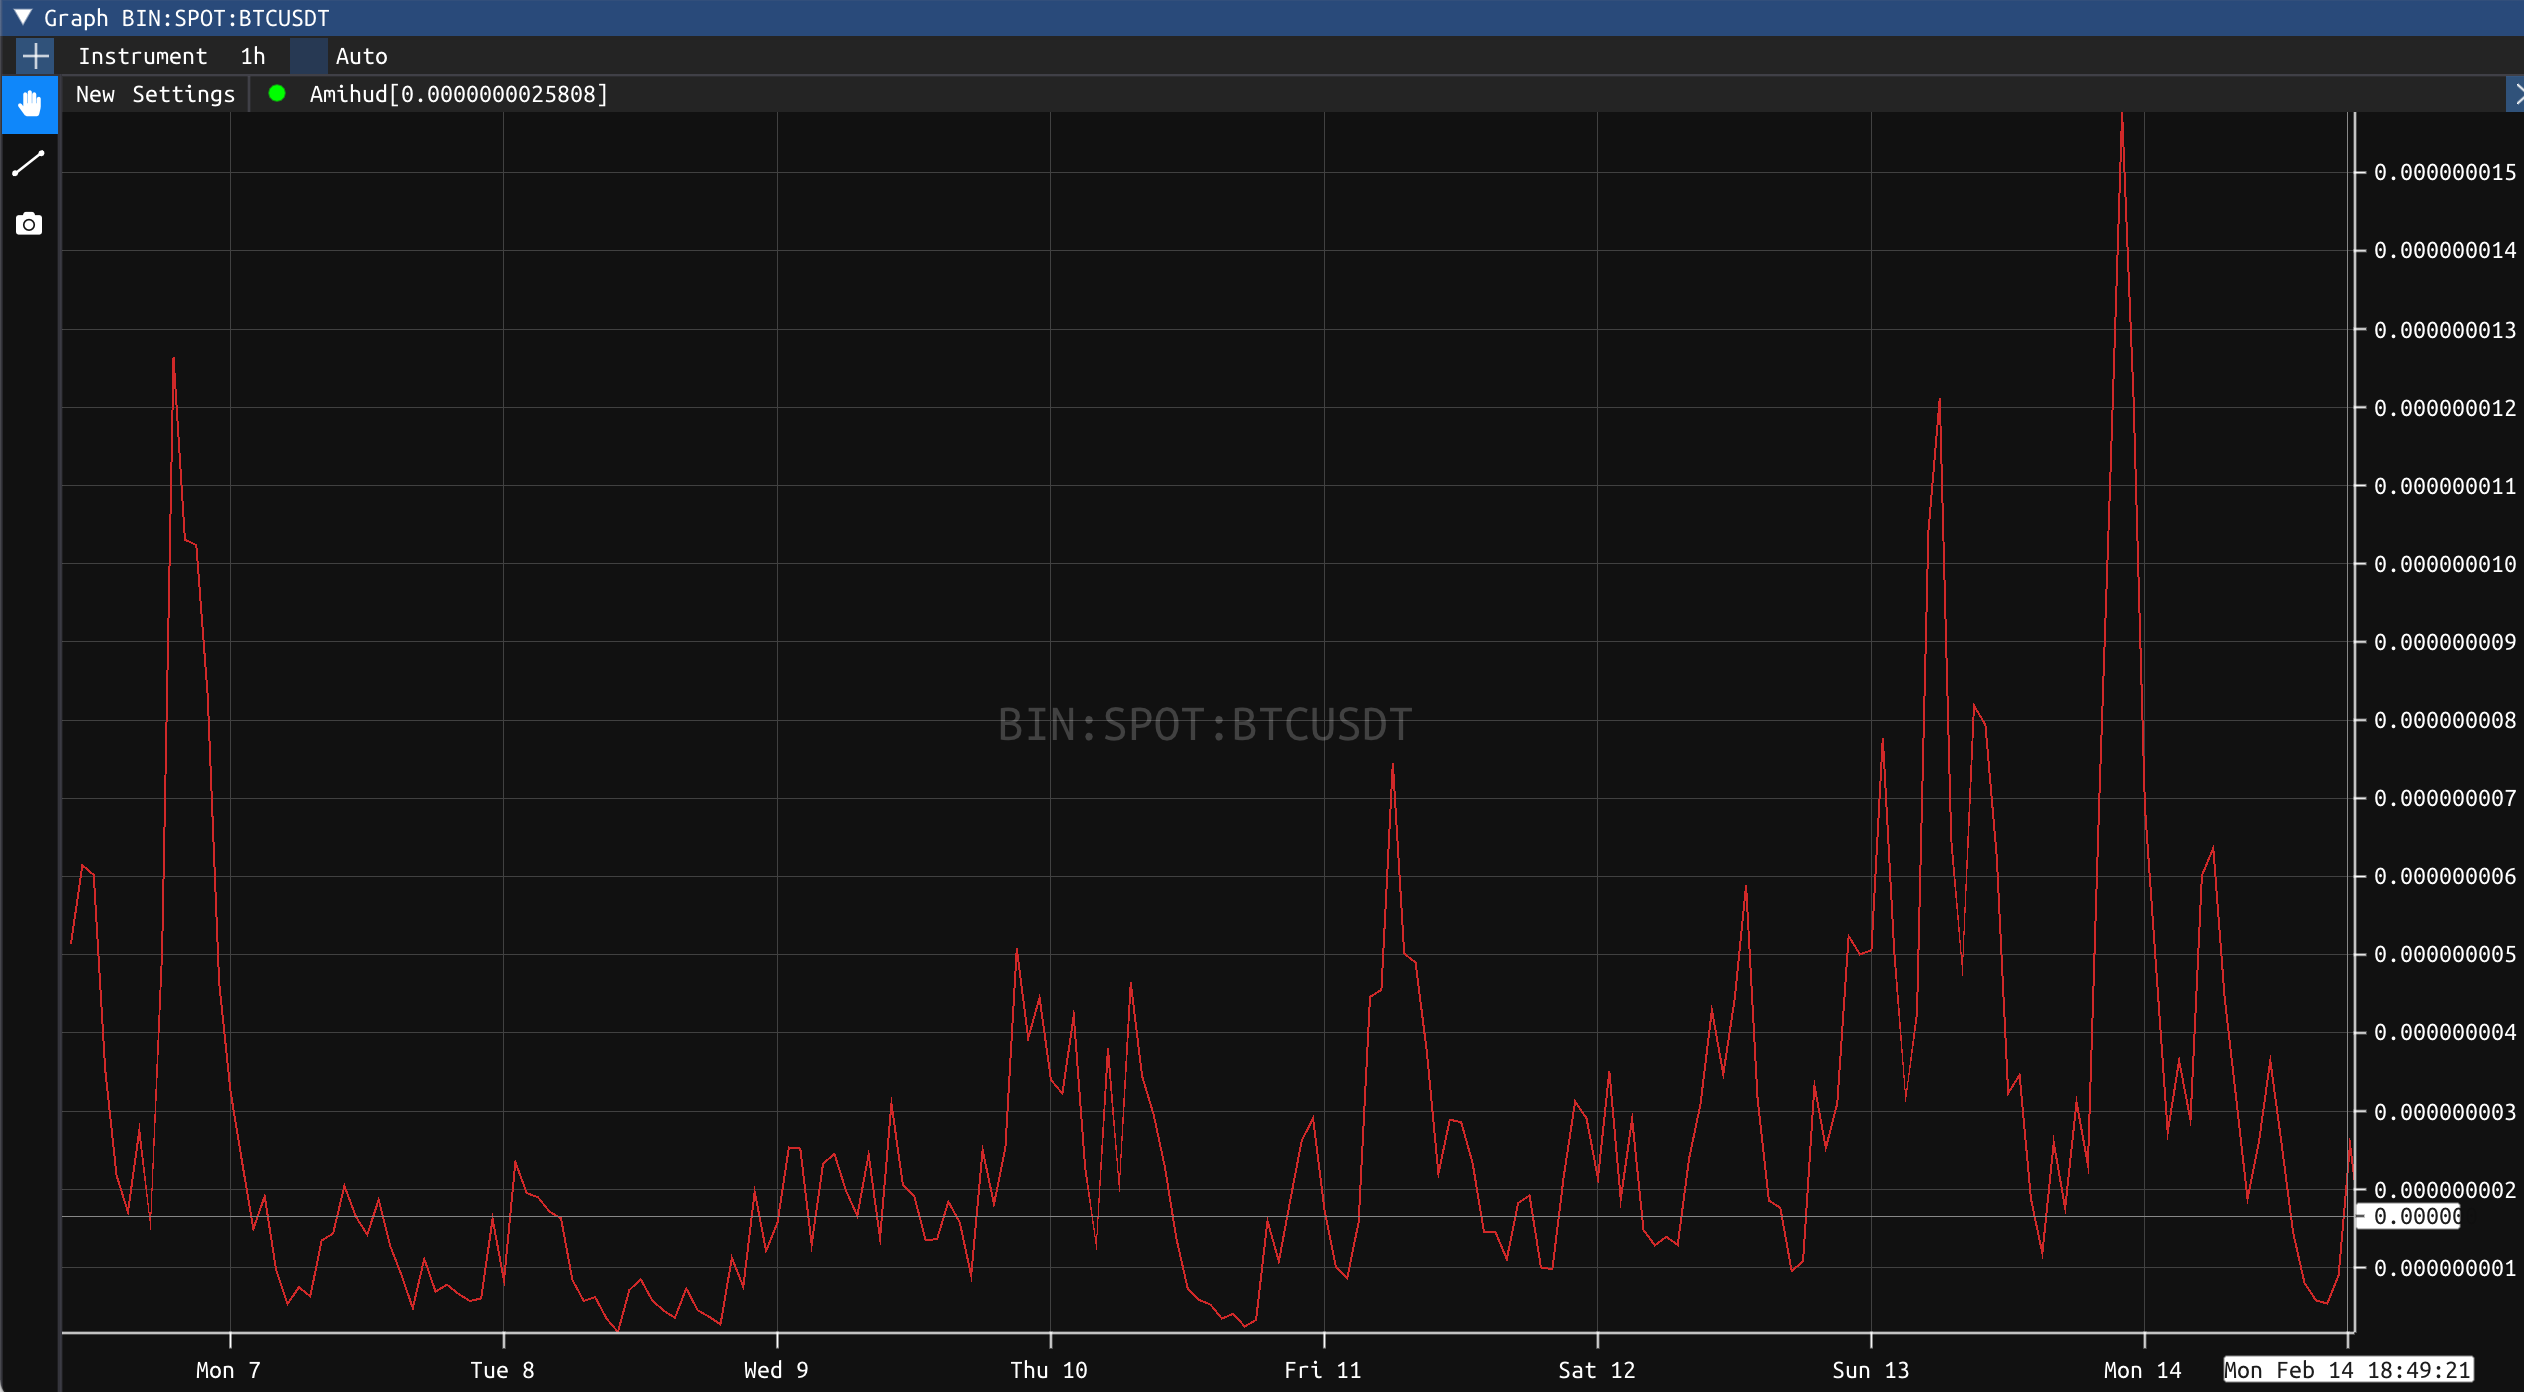
Sell Pressure
The Sell Pressure is a measurement of how much sell orders hit the book, relative on the amount of resting bids in the book. If there is a large amount of sell orders on a book with low bid liquidity, the indicator will be high. Inversely, if there is a small amount of sell orders on a book with high bid liquidity, the indicator will be low. This indicator is a proxy of the impact of sell orders on the book. A high sell pressure is bearish, and a low sell pressure indicates a zone of support. 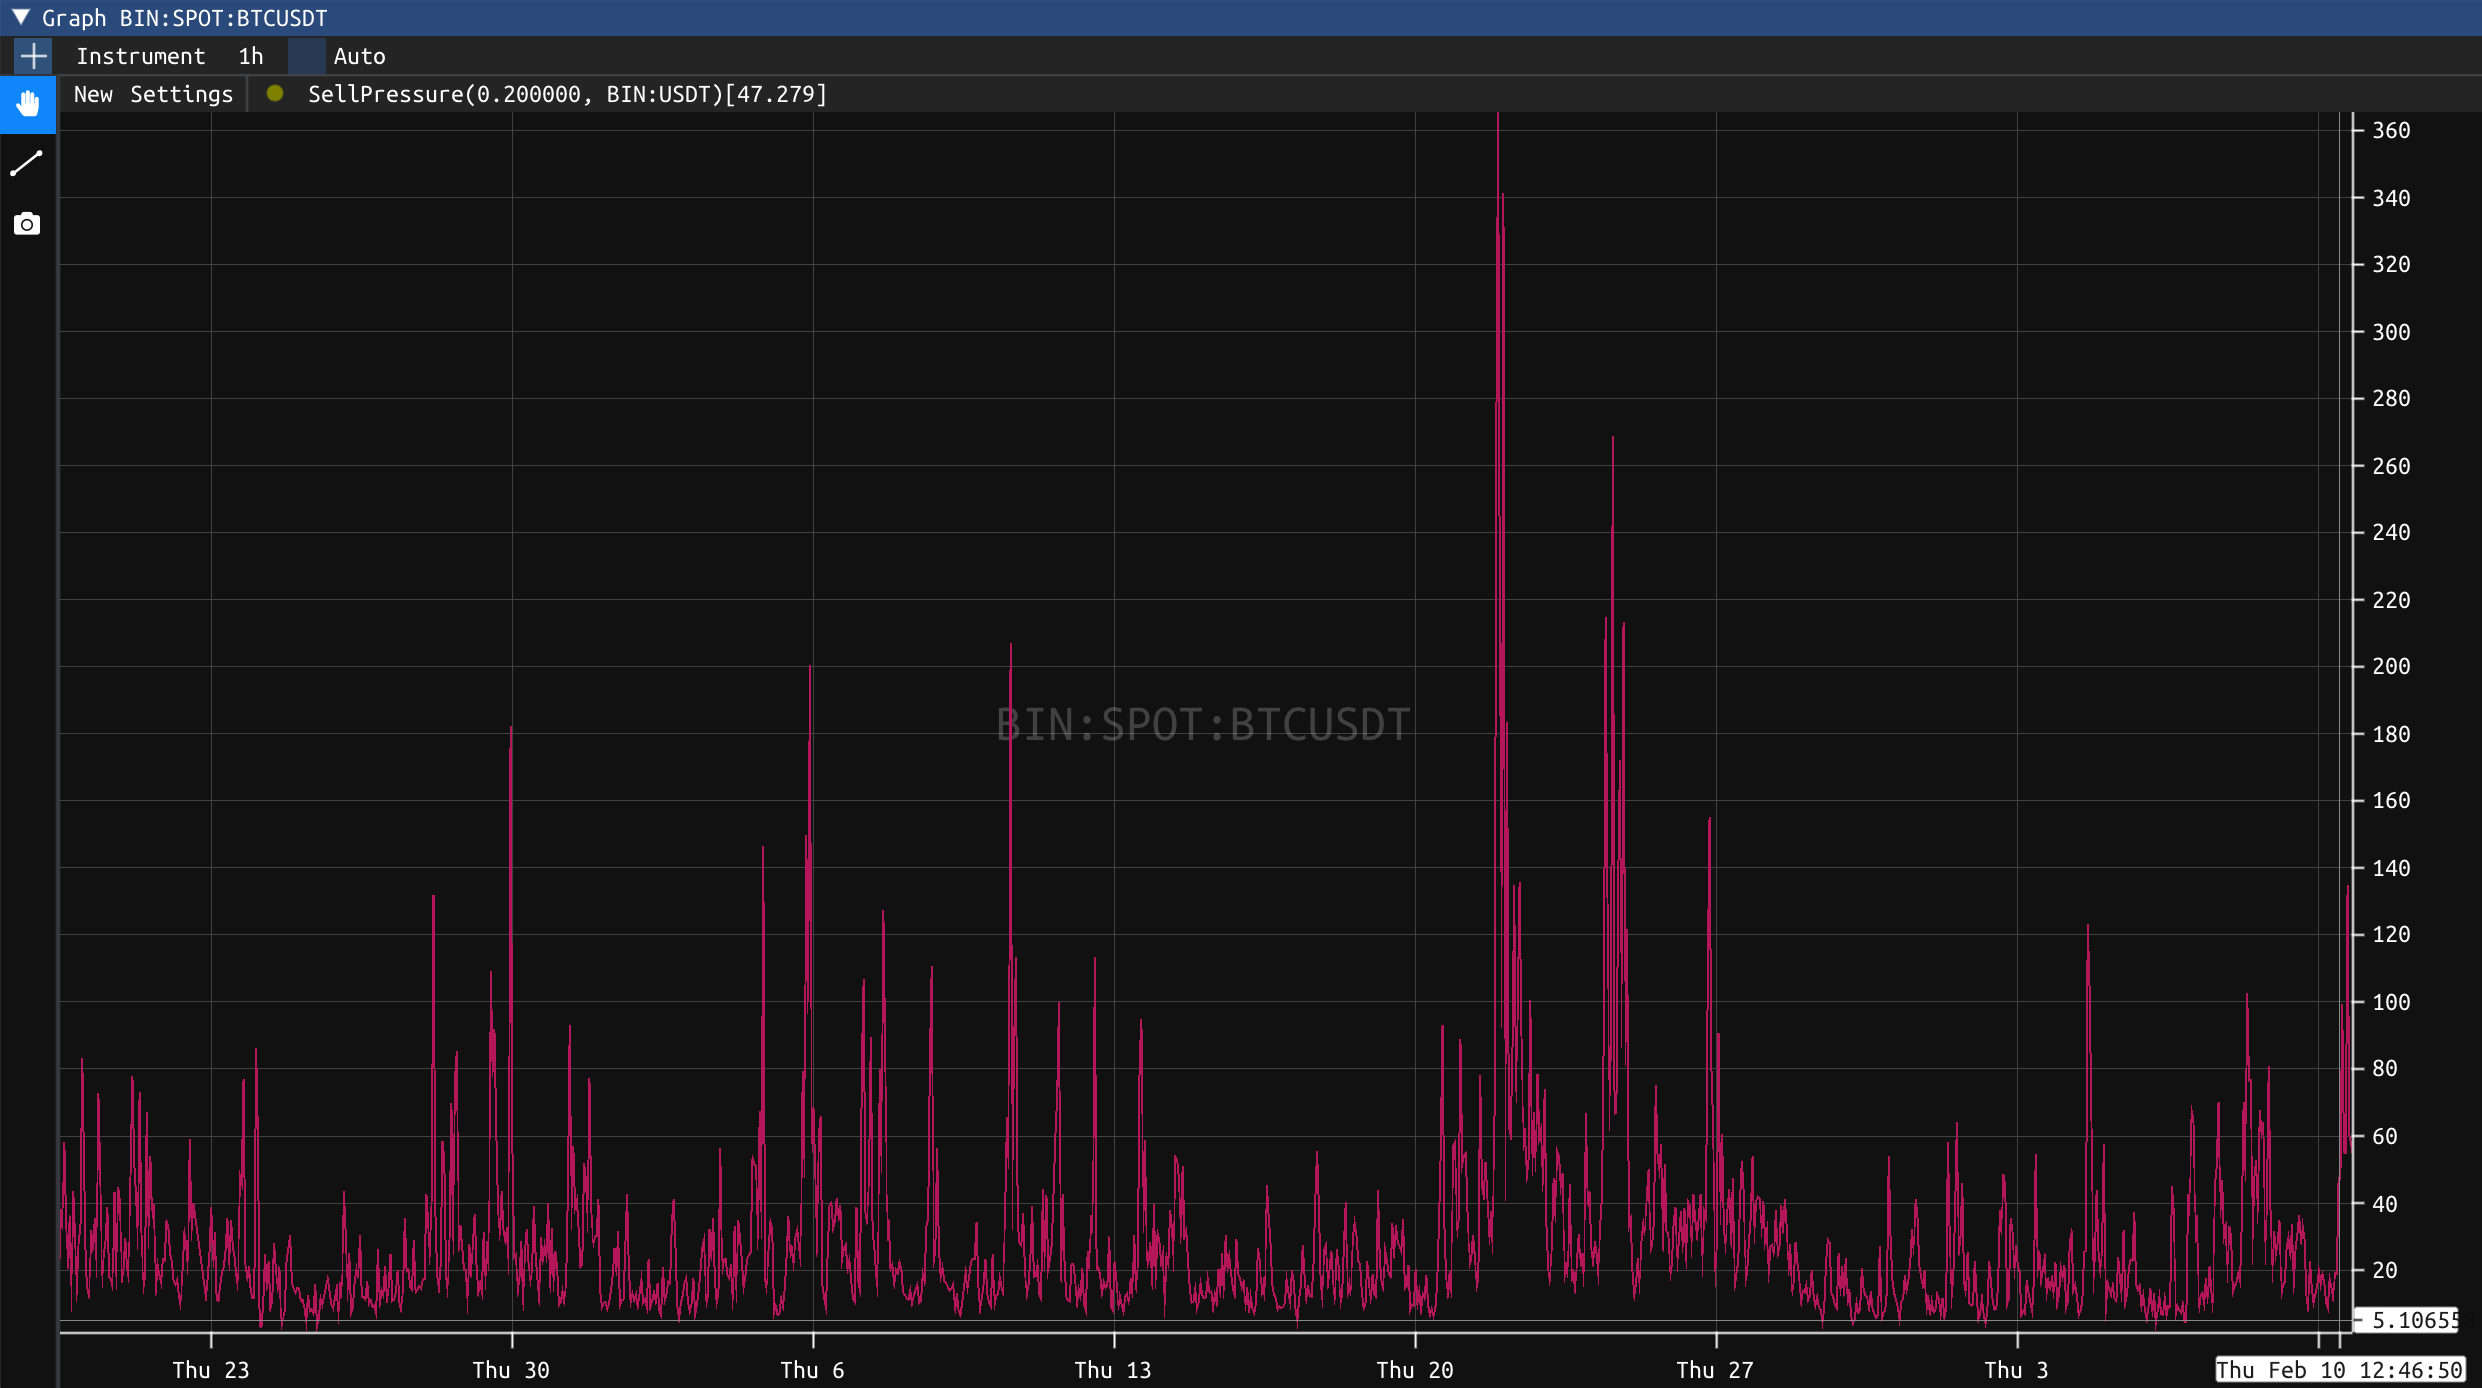
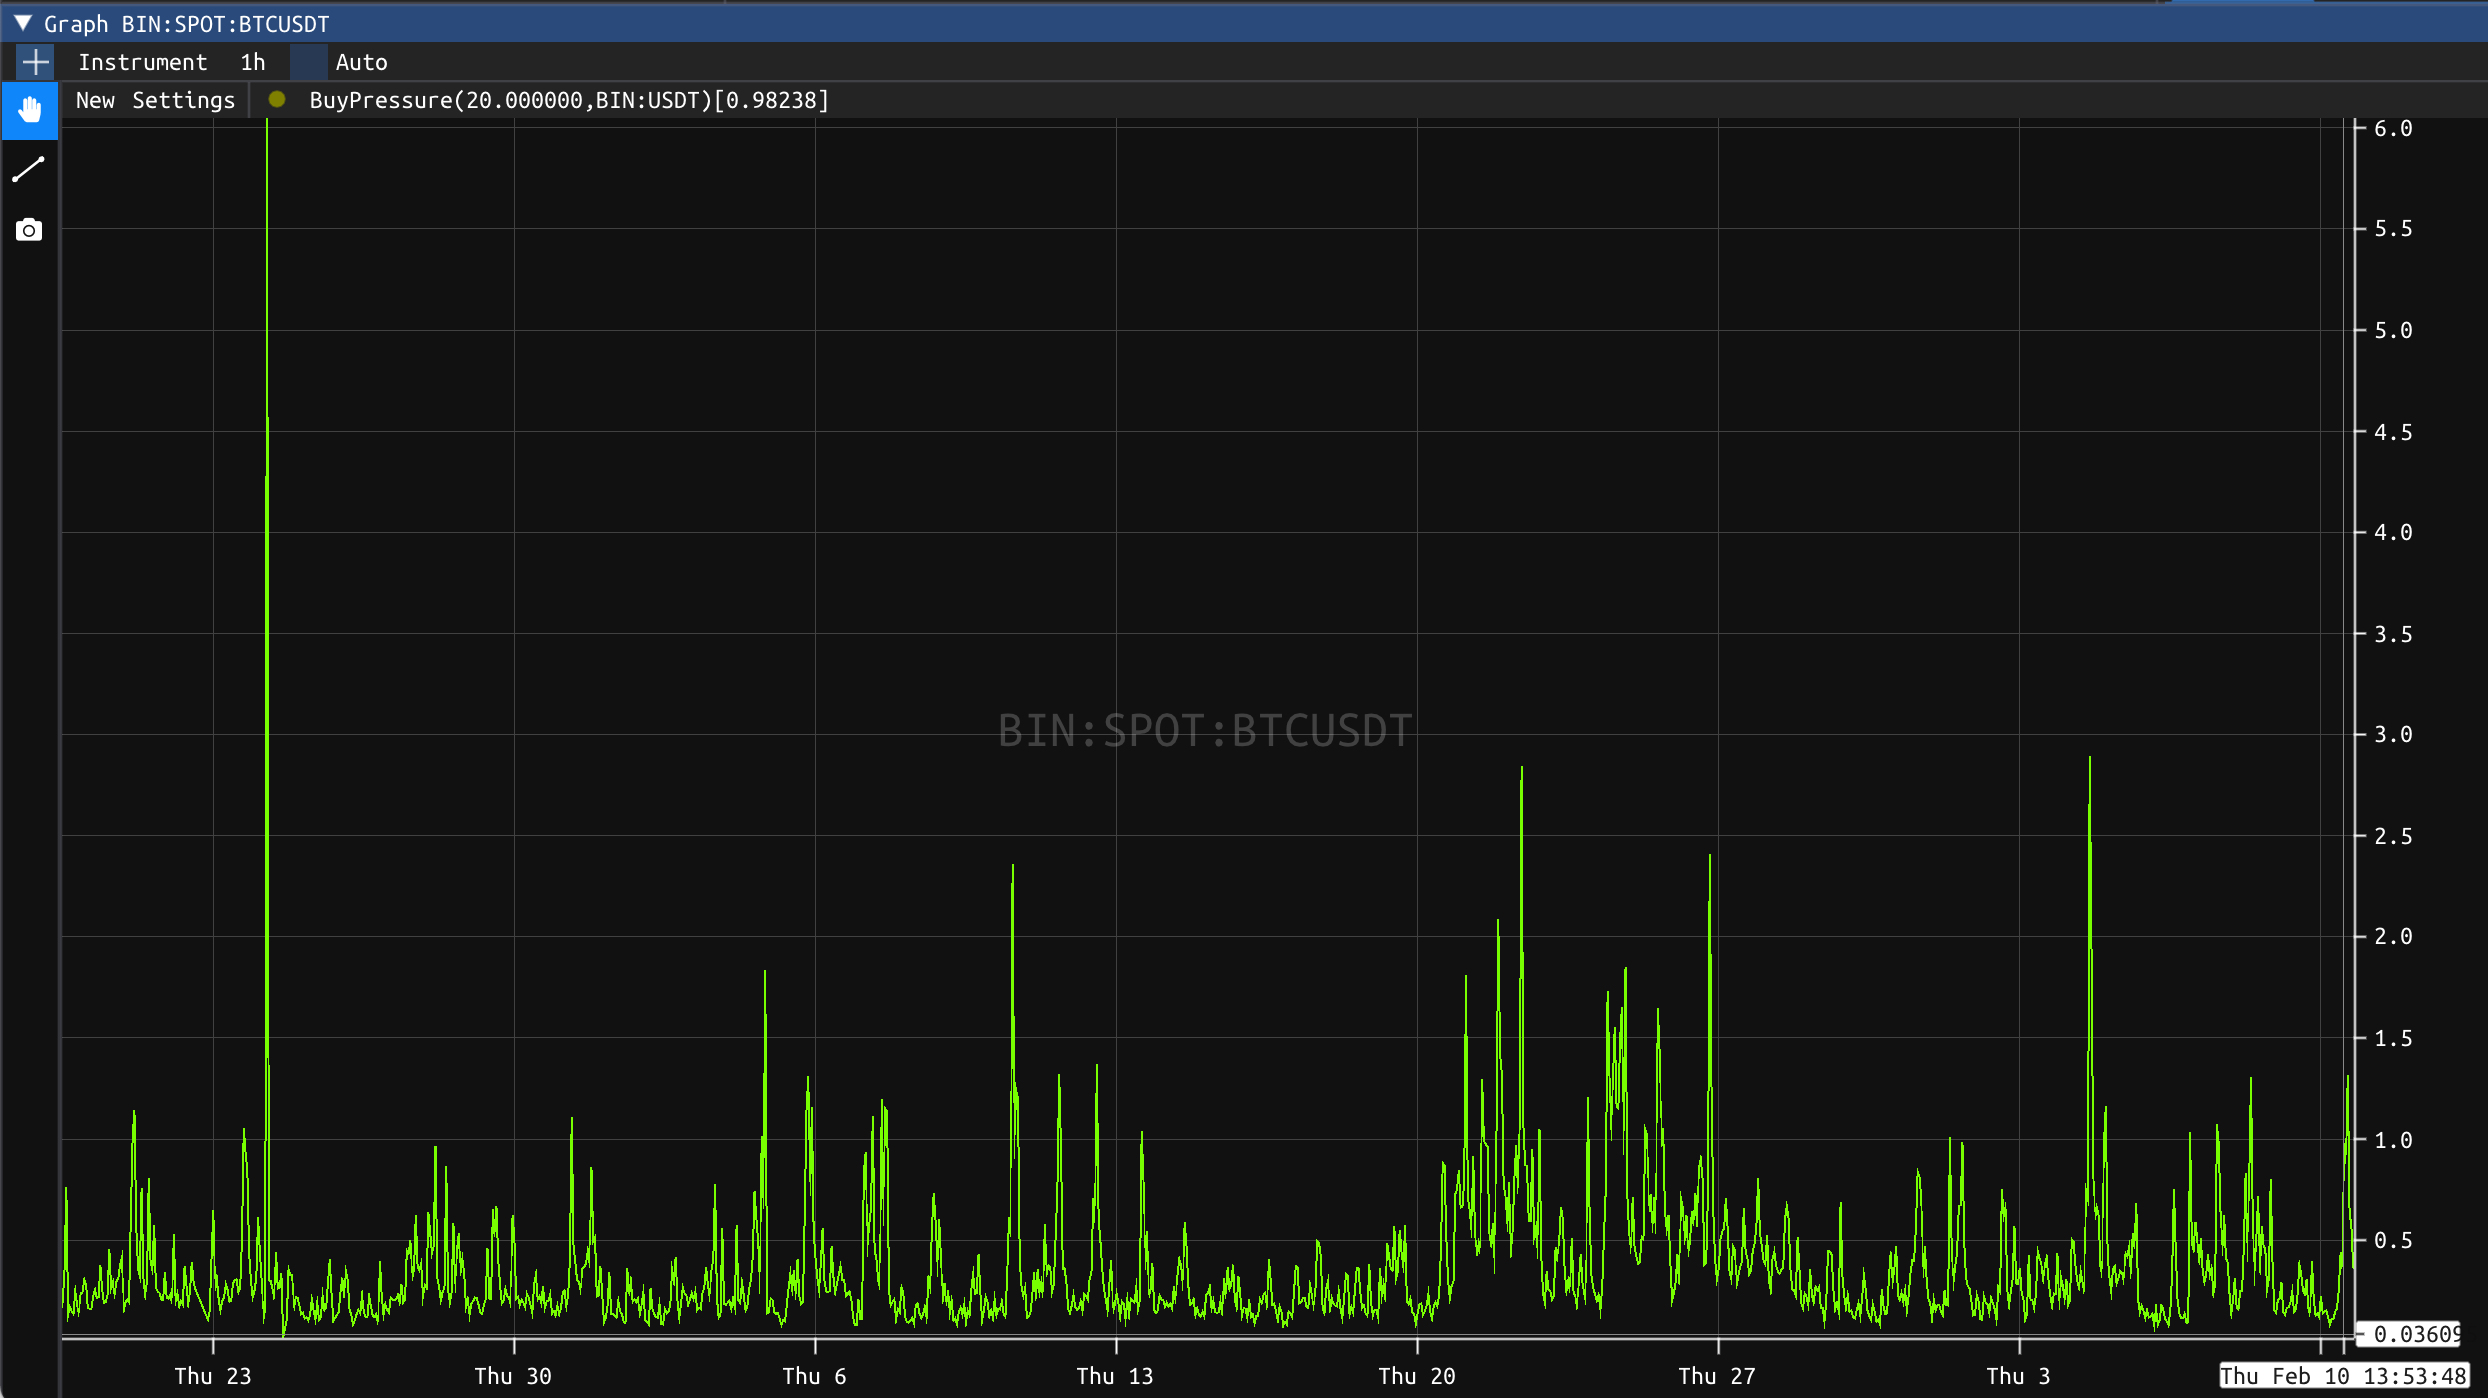
Buy Pressure
The Buy Pressure is a measurement of how much buy orders hit the book, relative on the amount of resting asks in the book. If there is a large amount of buy orders on a book with low ask liquidity, the indicator will be high. Inversely, if there is a small amount of buy orders on a book with high ask liquidity, the indicator will be low. This indicator is a proxy of the impact of buy orders on the book. A high buy pressure is bullish, and a low buy pressure indicates a zone of resistance.
Net Pressure
The Net Pressure is the difference between the Buy Pressure and the Sell Pressure indicator defined above 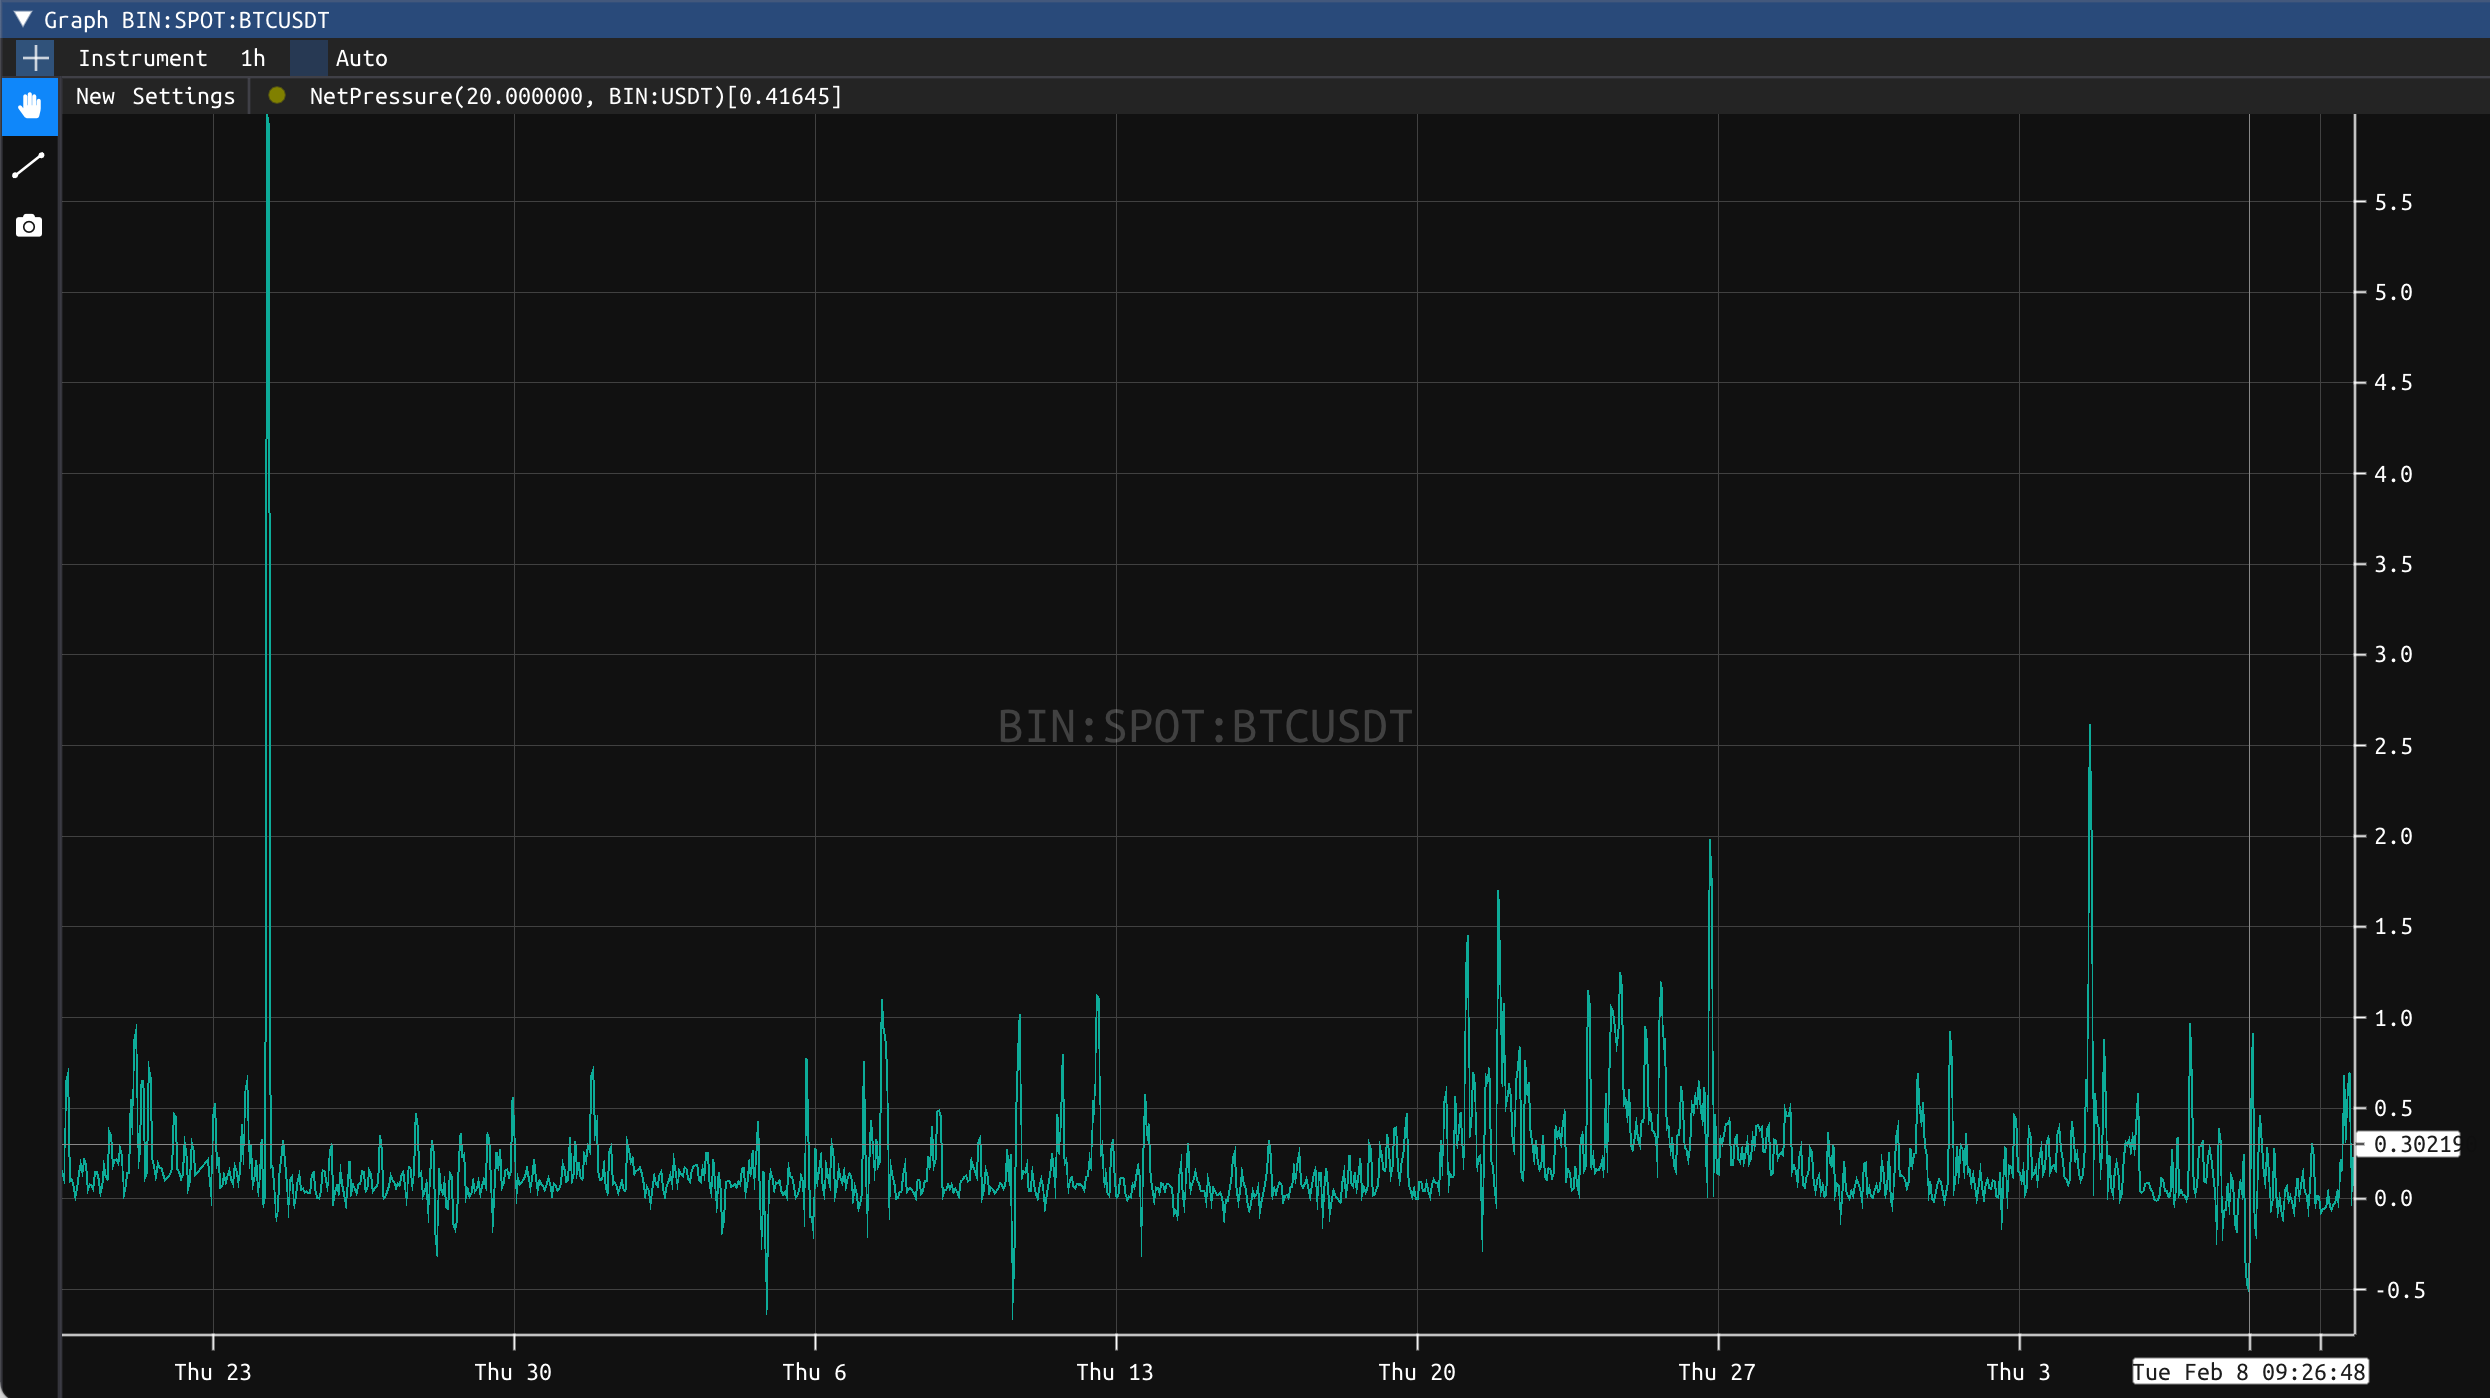
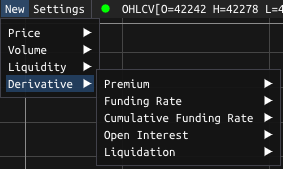
Derivative
Premium
The Premium is calculated by taking the ratio between the two selected instruments. 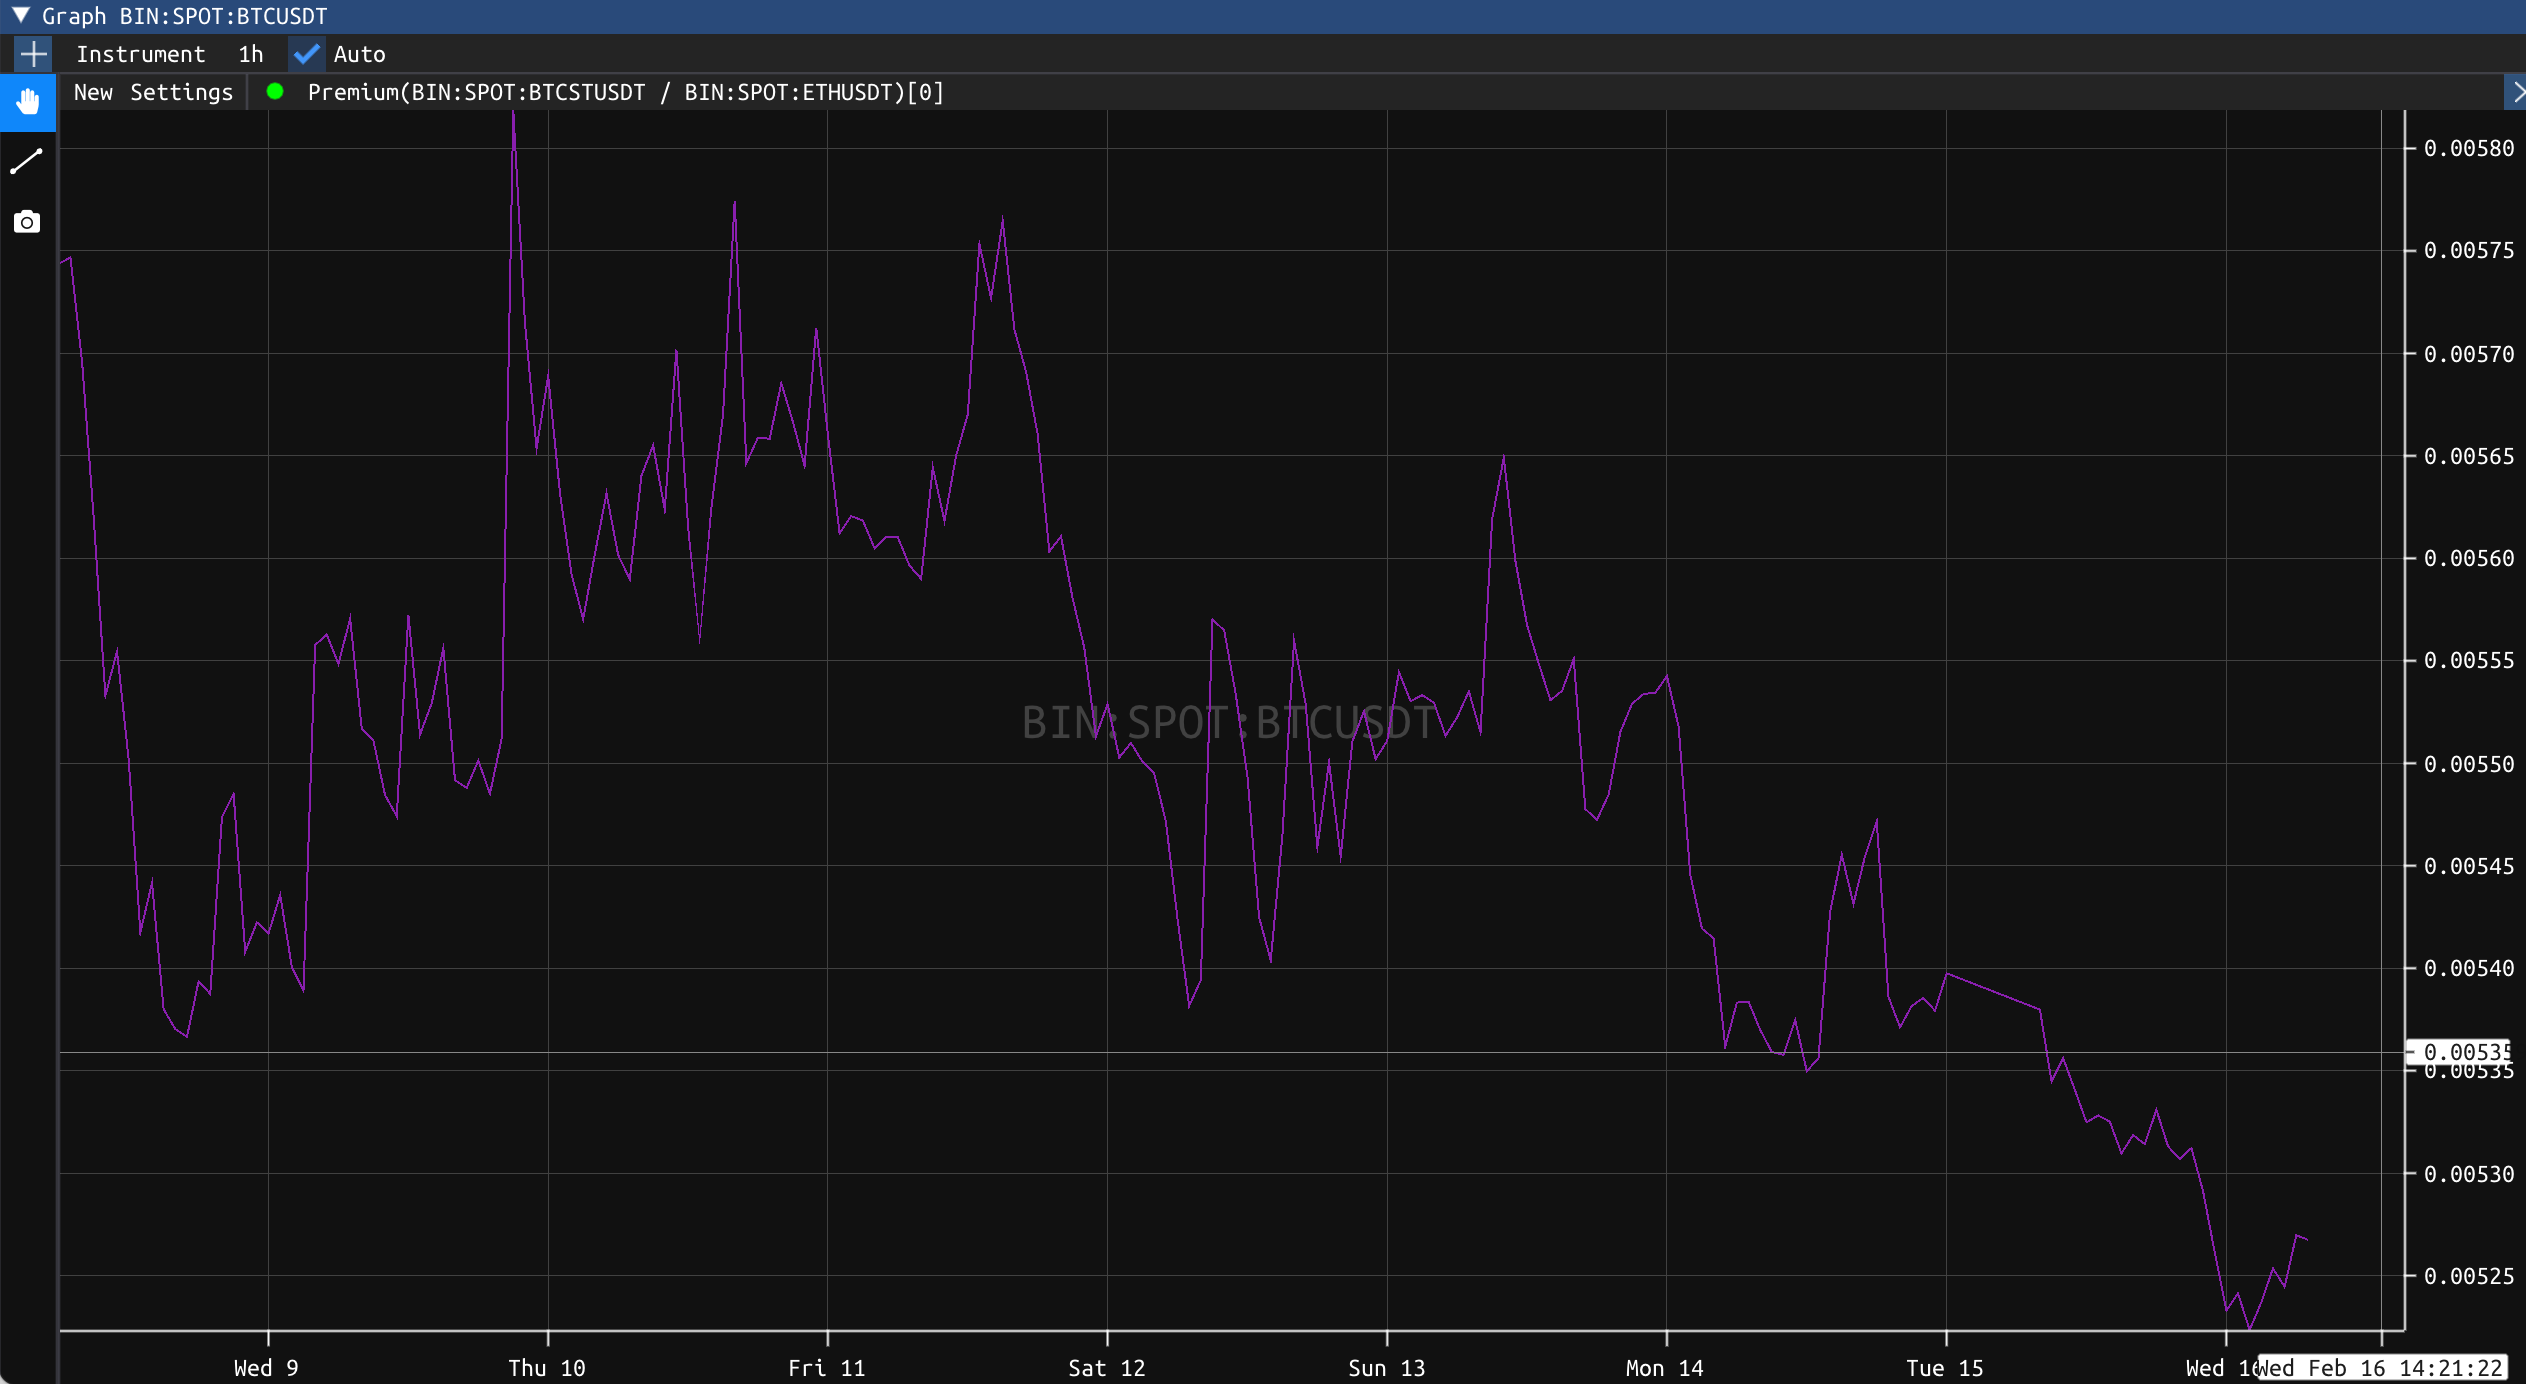
Funding Rate
The Funding Rate is a periodic payment made to traders based on their long or short positions given the difference in perpetual market and spot market price of an asset. 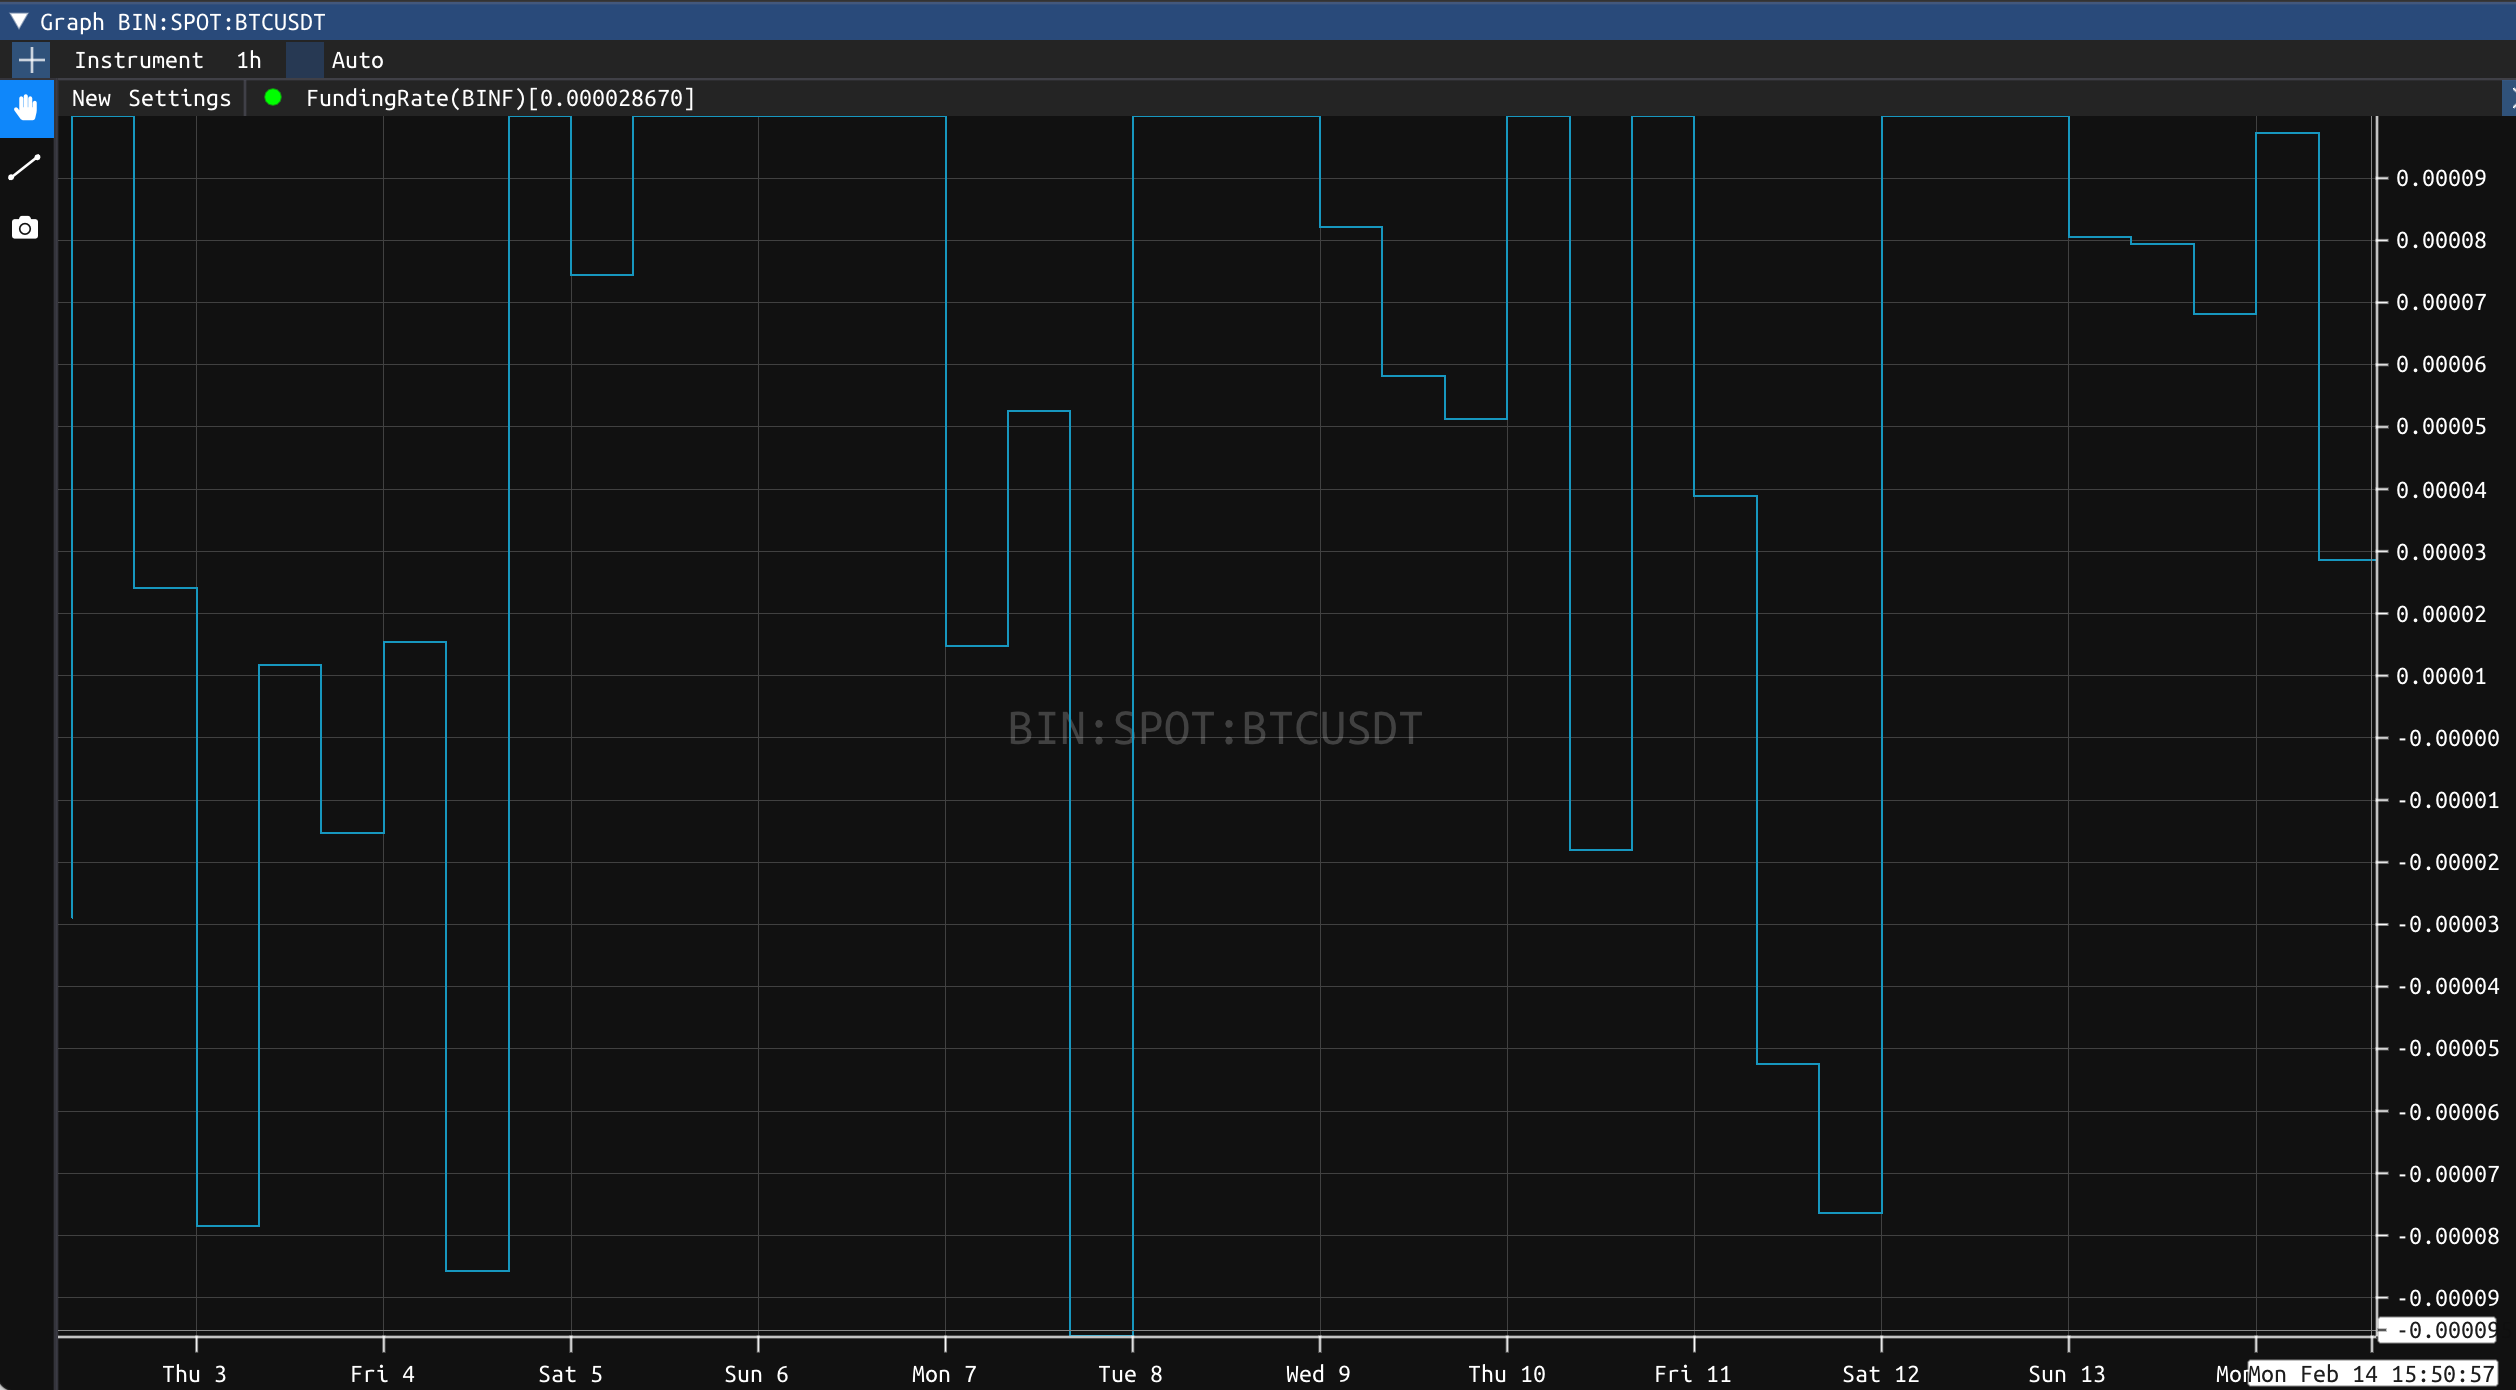
Cumulative Funding Rate
The Cumulative Funding Rate is the cumulative function of the previously described funding rate metric. 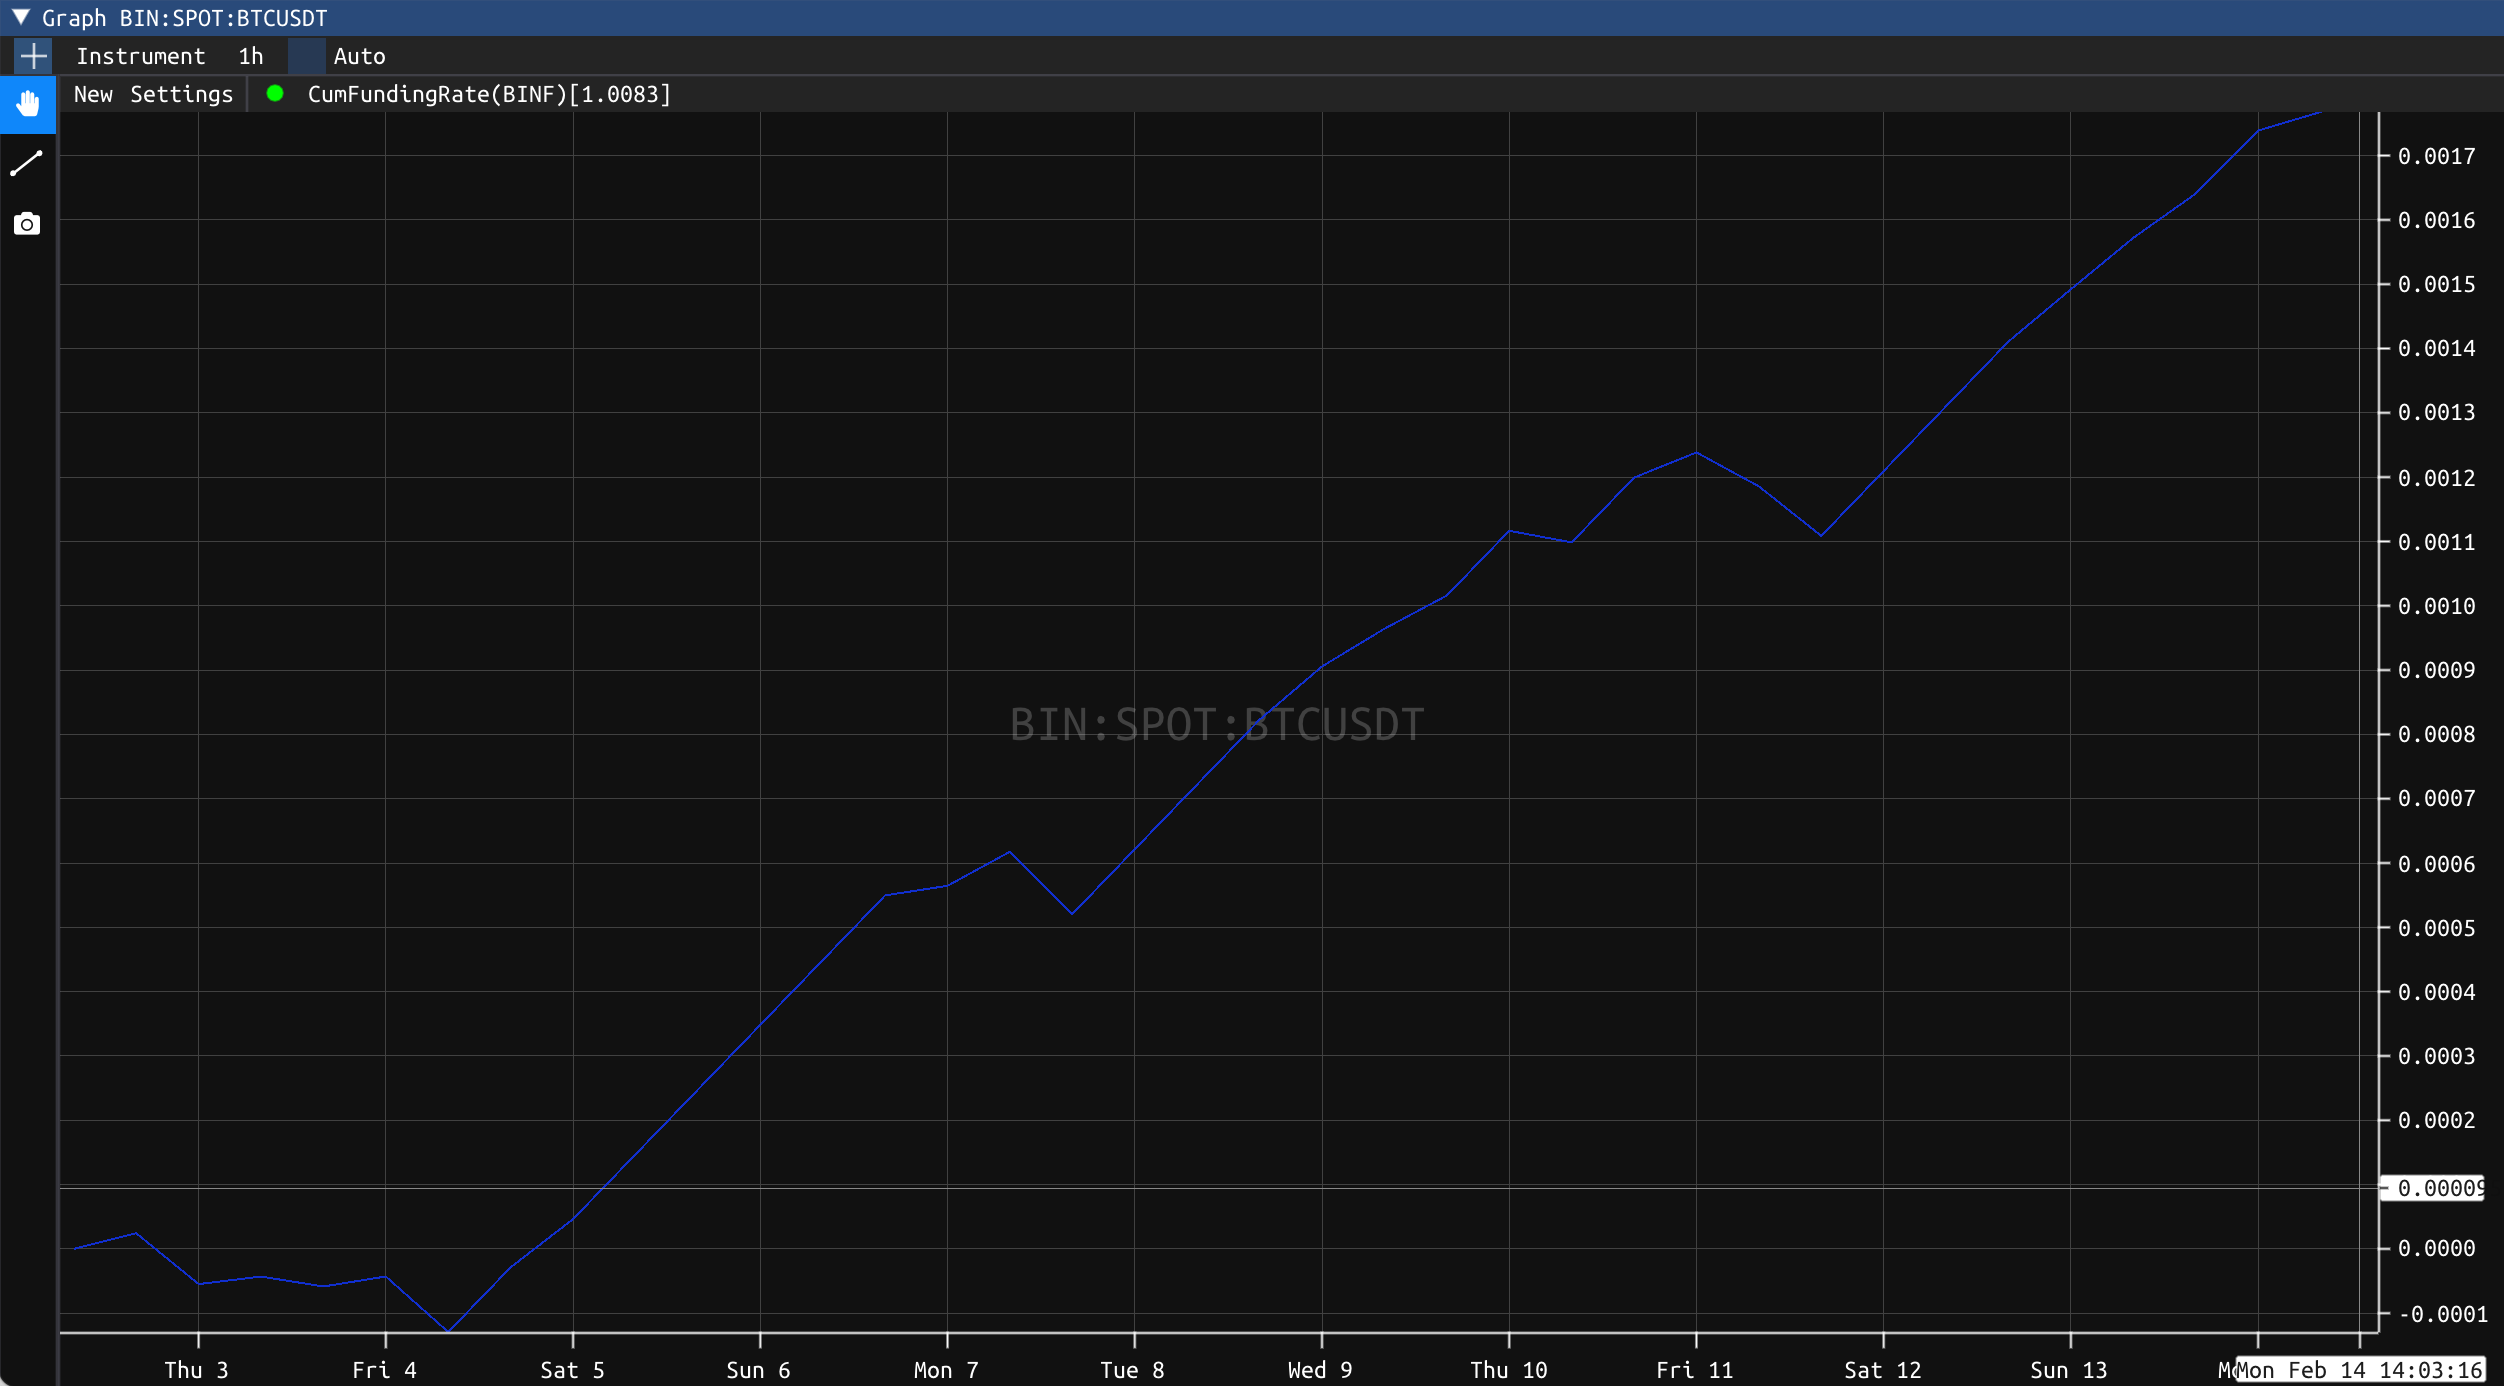
Open Interest
The Open Interest is a measure of the total amount of open contracts currently on the future and perpetual markets. 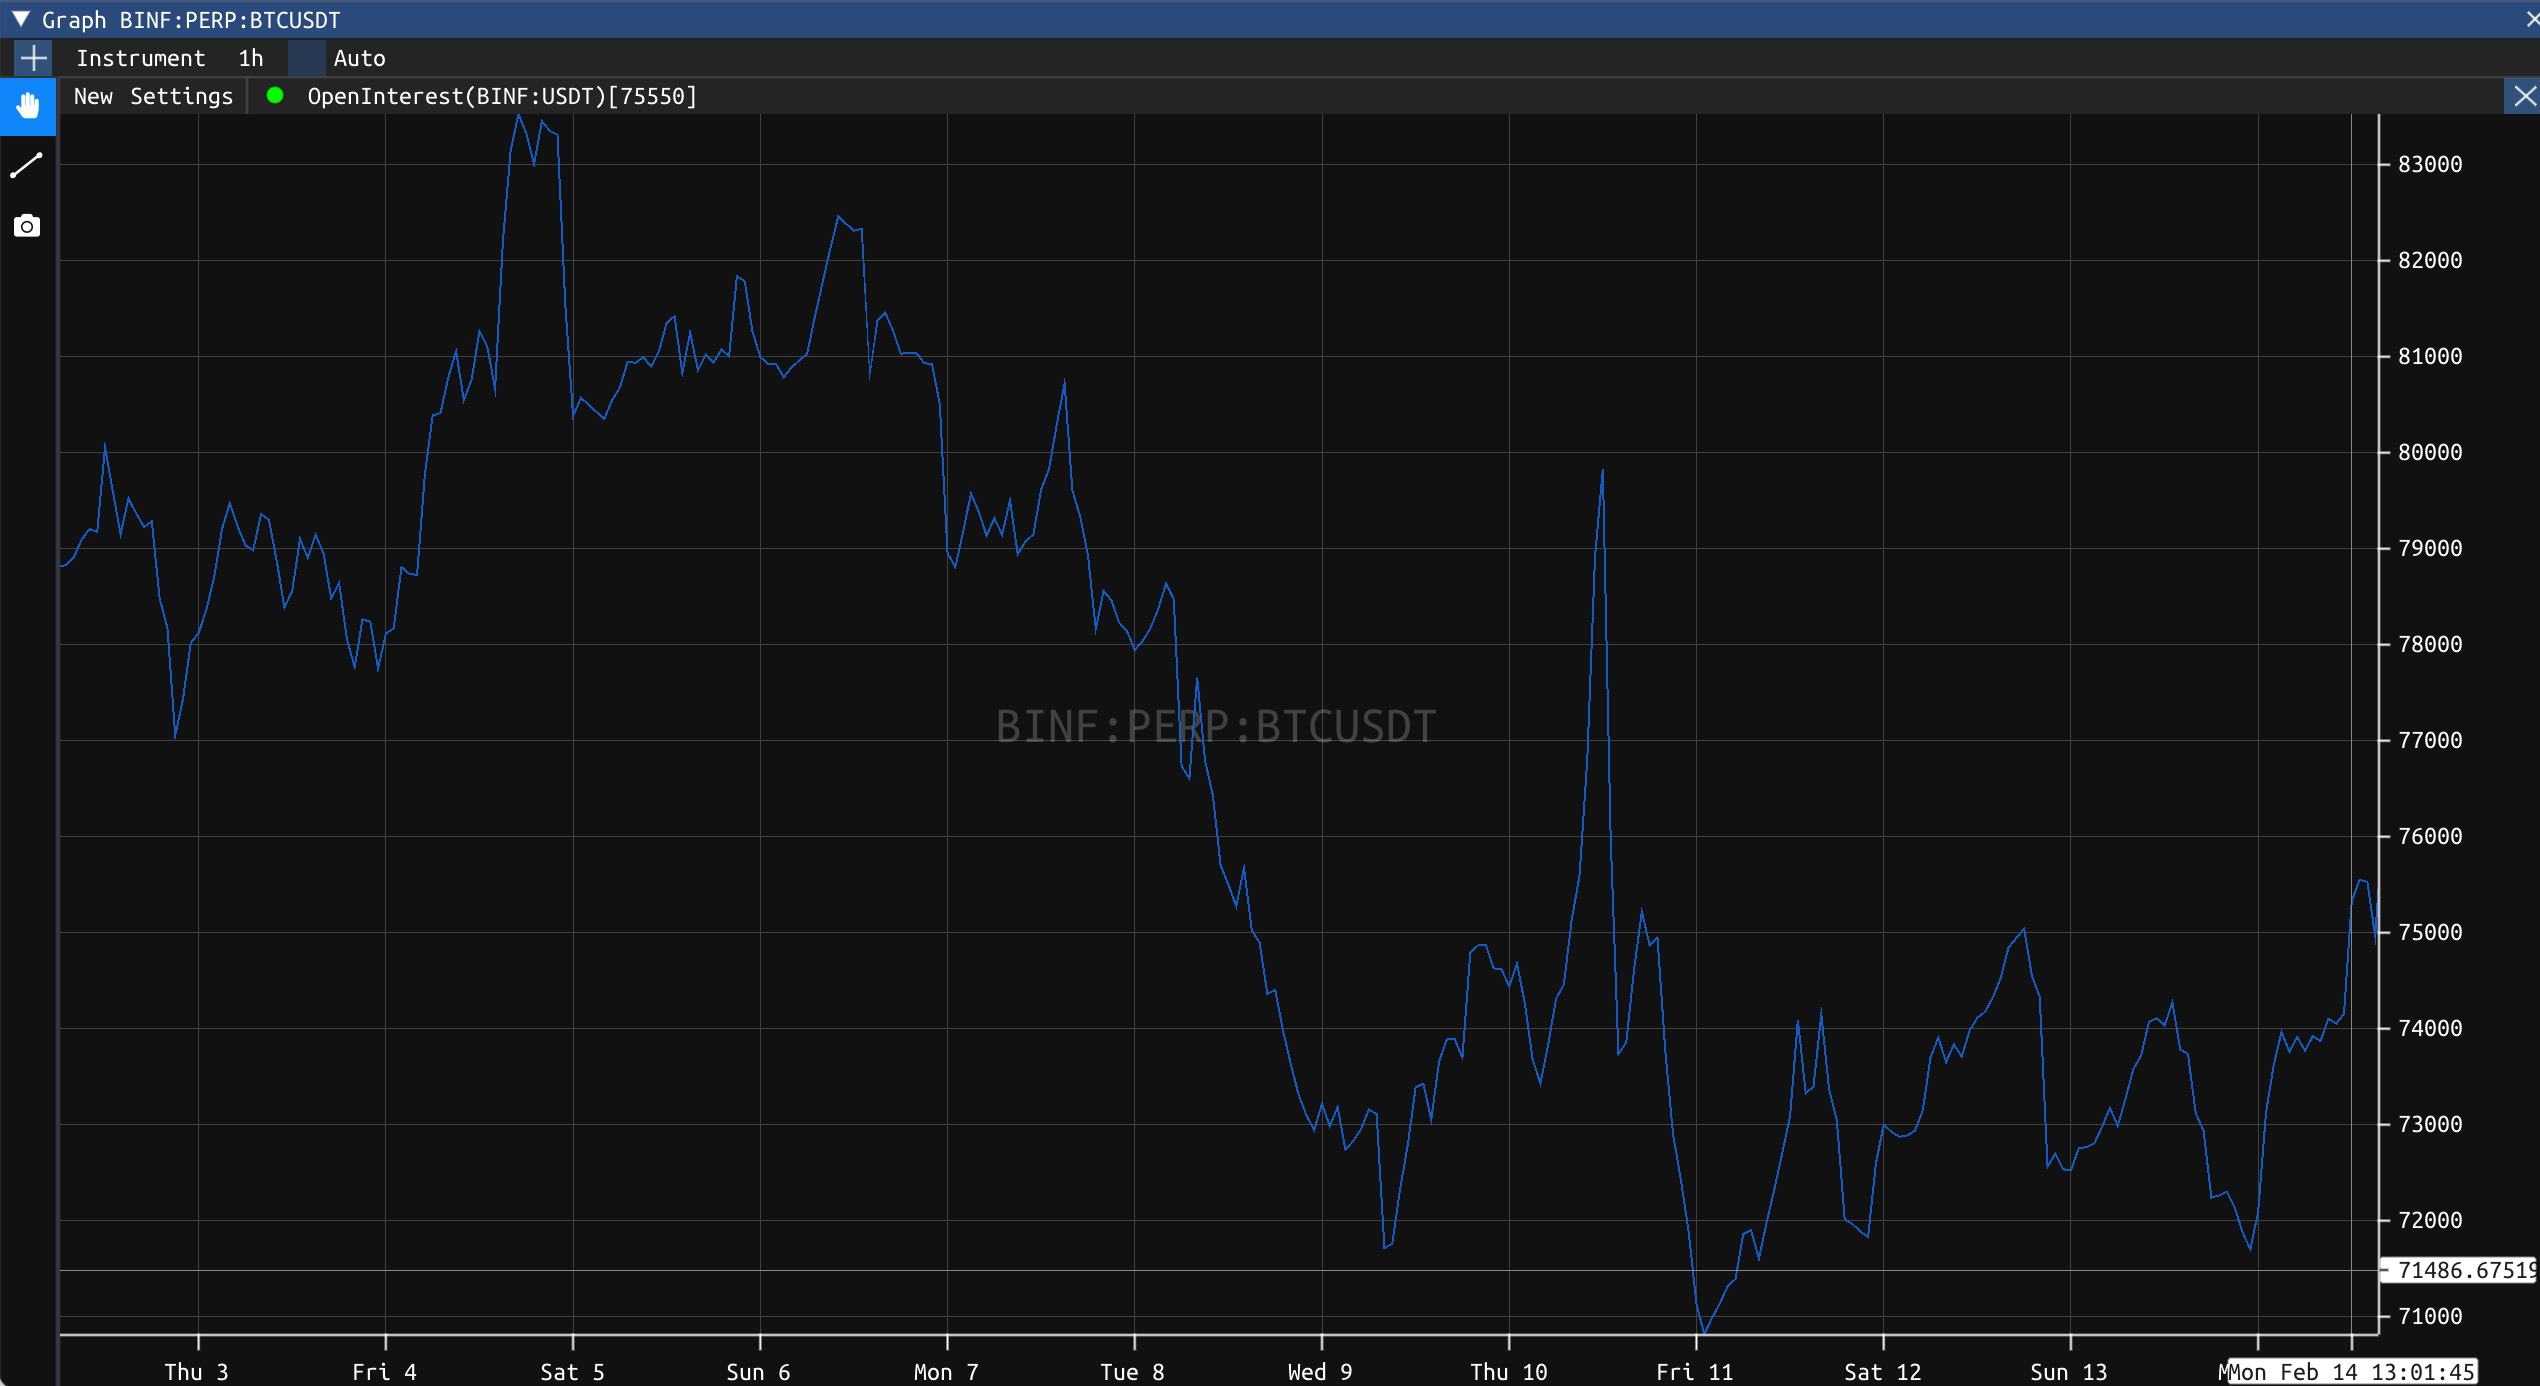
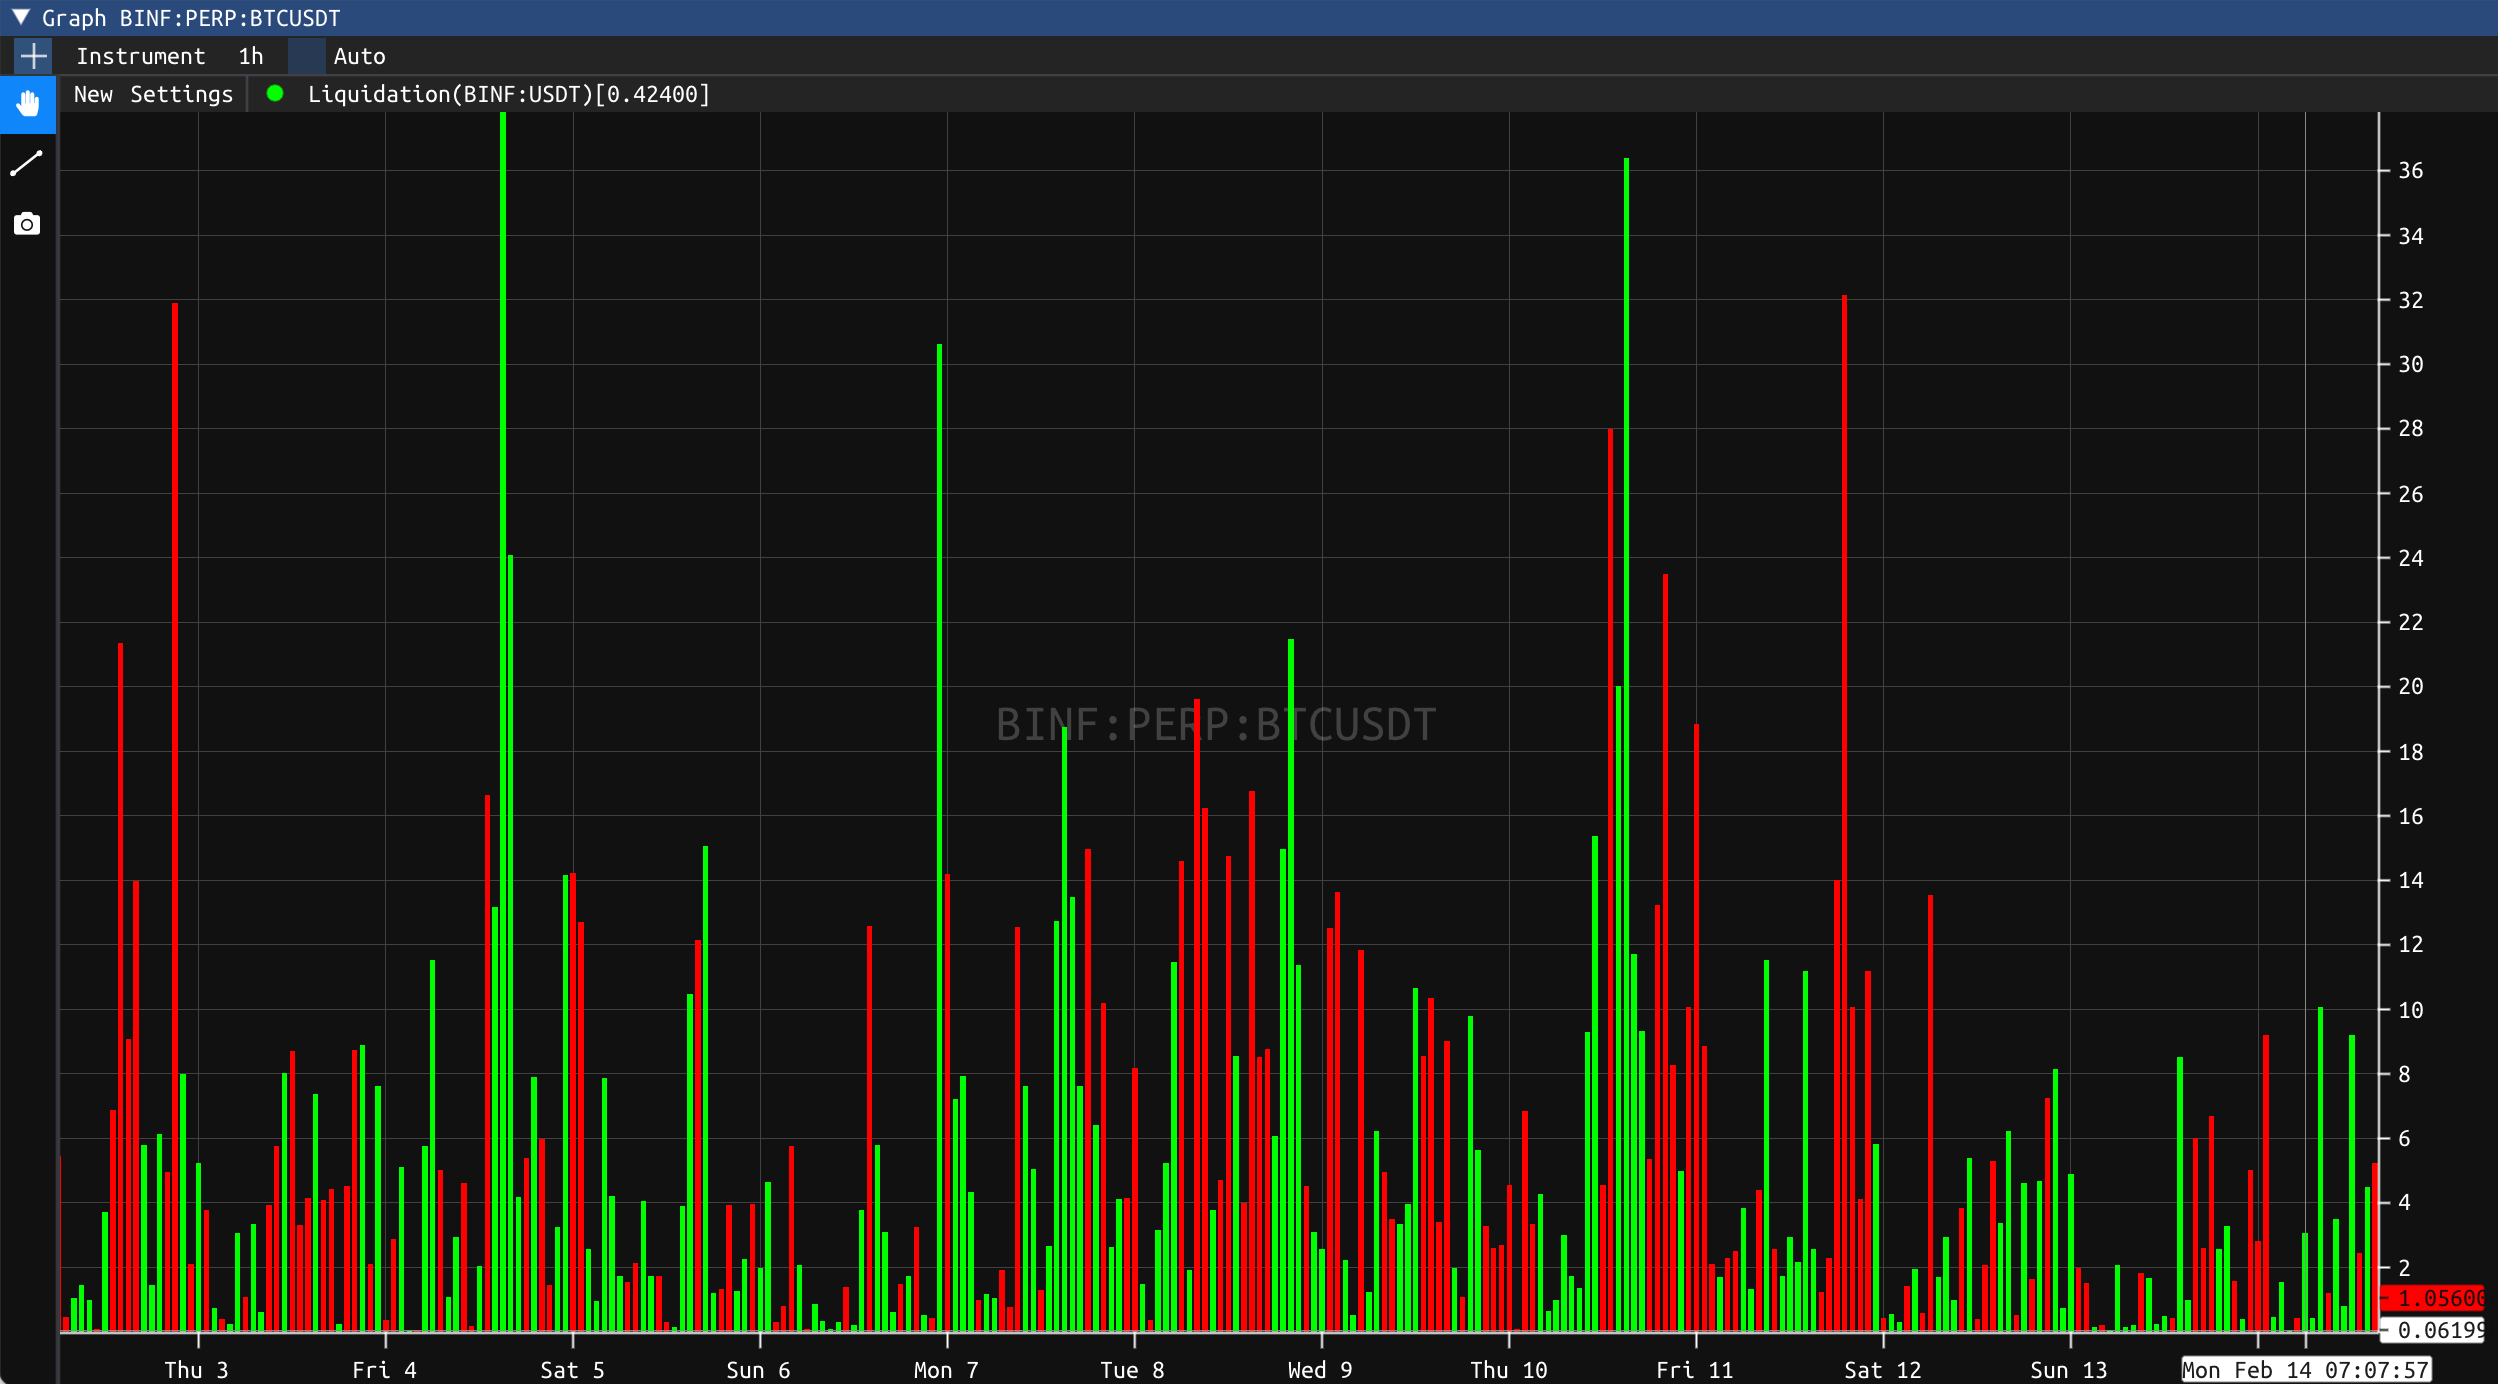
Liquidation
The Liquidation metric allows you to display the total amount of instrument liquidated for a given period. The green bars correspond to short positions which have been liquidated by a buy, while red bars are long positions liquidated by a sell.